Creating New Plots
Introducing the new Plot Builder in ProjectionLab v2.6.0, enabling you to create custom plots with any metrics and visualize your financial data in more engaging ways.

One of the things I’ve been hearing lately is people want to see more plot types. But not everyone cares about the same metrics, so what to do? How about: let you plot whatever you want? 😜
It’s been a busy few weeks of coding, and with the release of v2.6.0 you can now quickly make your favorite plots using whatever metrics you like… and also a whole bunch of other stuff! But here we’ll focus on the custom plots.
Launching the Plot Builder
You can launch the Plot Builder from the primary chart drop-down, or via Chart Options:
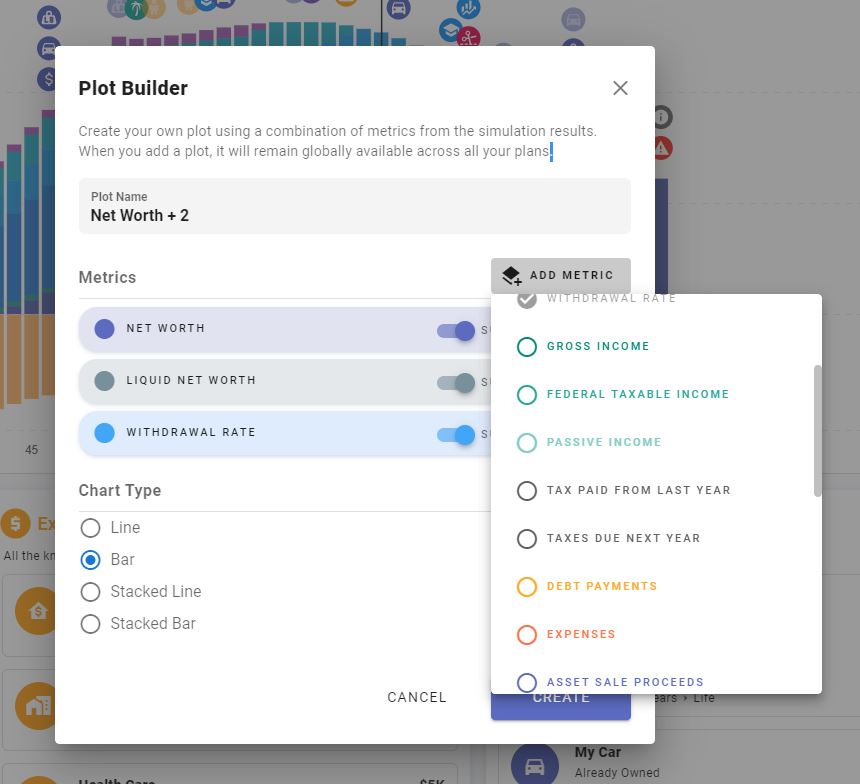
Add any combination of metrics you like, pick a chart type, and customize the colors for each dataset. You can also choose whether broad categories like “Net Worth” are aggregated and presented as a single total, or if you want to see each underlying line item as its own dataset.
Examples of Custom Plots
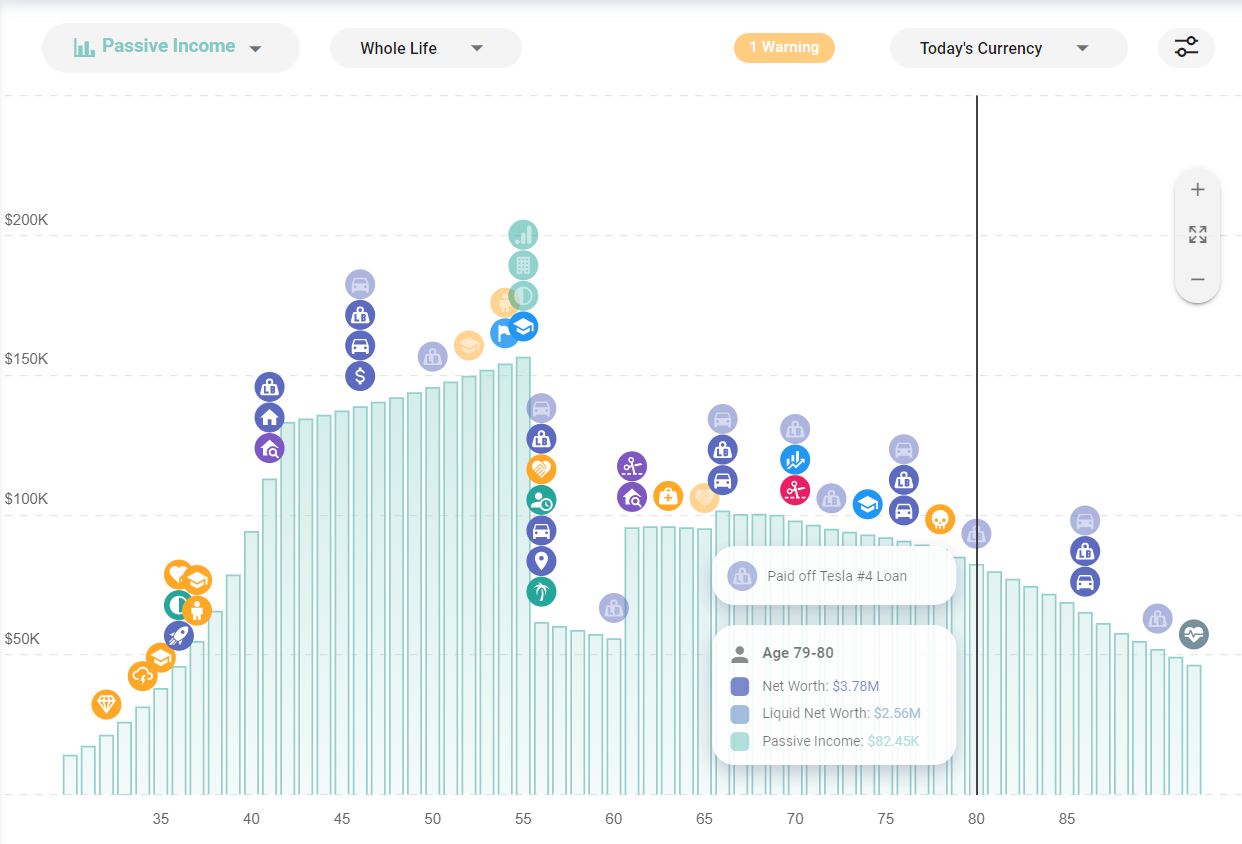
Passive Income with Aggregation
Here’s a simple example where we plot the new Passive Income metric with aggregation enabled, so we just see the total for each year:
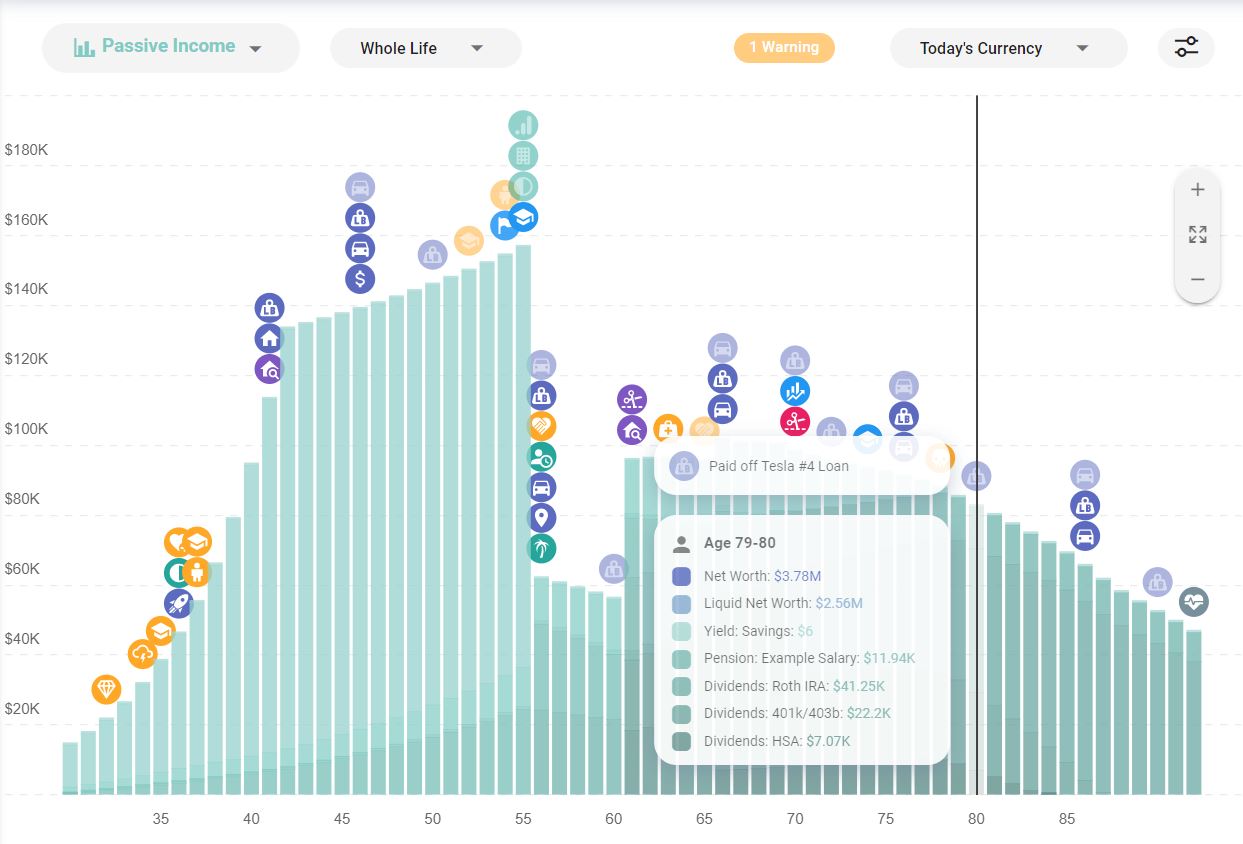
Splitting Out Underlying Items
And here’s the same plot with all the underlying items split out as their own datasets. The chart type has also been updated to Stacked Bar:
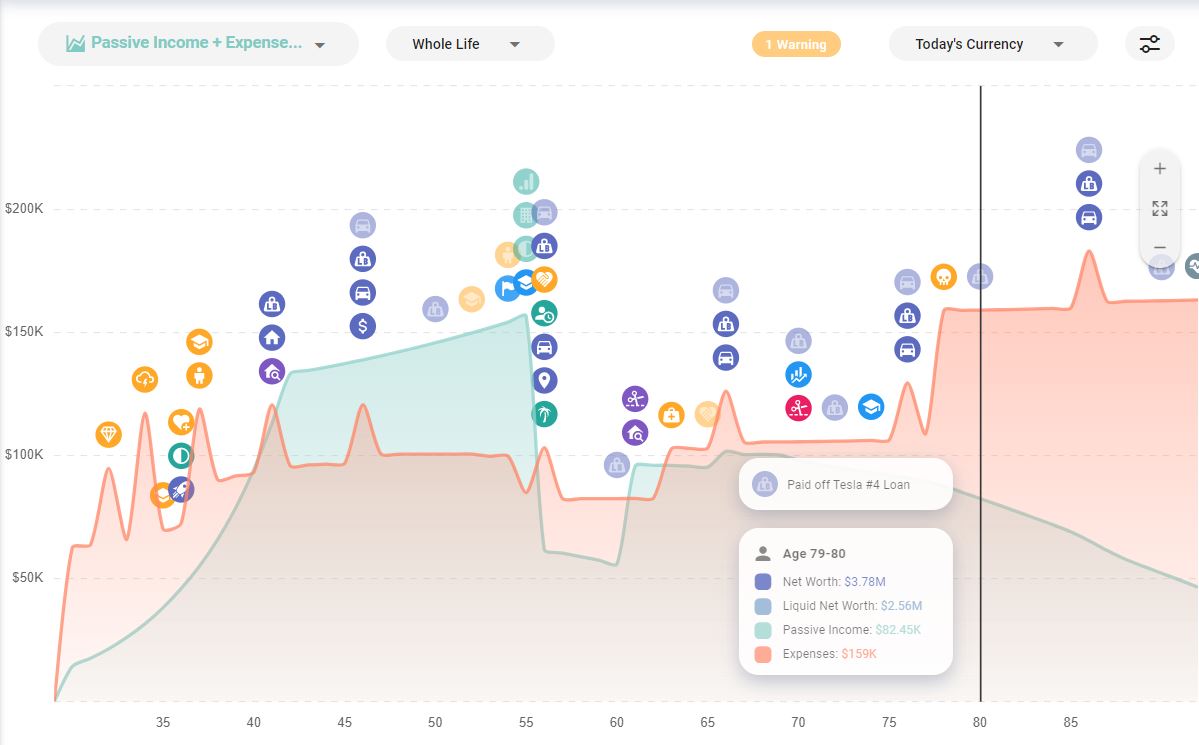
Comparing Passive Income to Total Expenses
Now let’s see how things look if we switch to a line chart and compare total Passive Income to Total Expenses:
Adding Withdrawal Rate
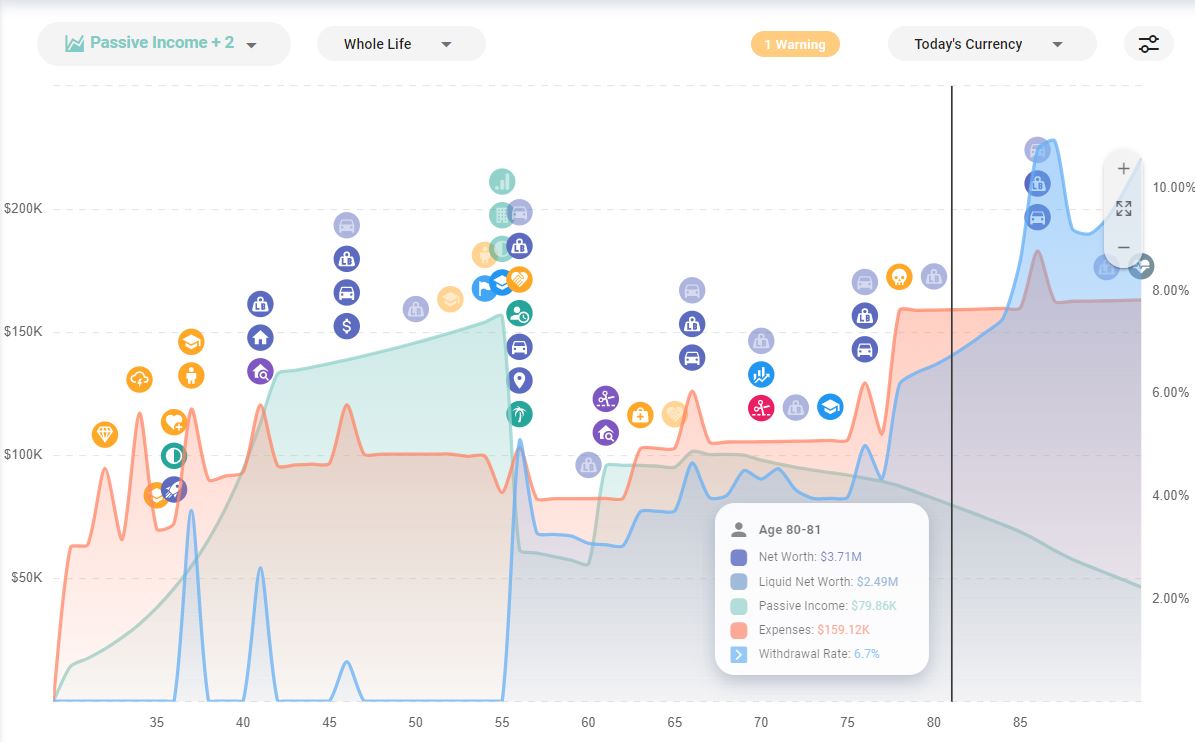
Then to make things even more interesting, we’ll add Withdrawal Rate and color that blue:
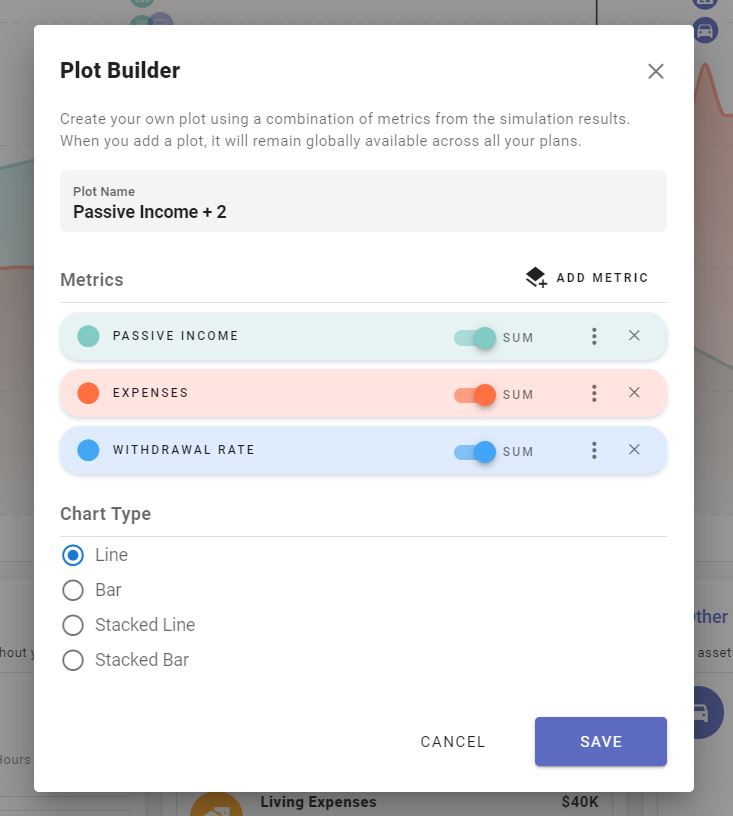
Here’s what that gives us. And notice that Withdrawal Rate automatically get its own y-axis on the right side expressed in %:
Jump into the ProjectionLab app and give the new Plot Builder a test drive! If you have questions, feedback, or suggestions to share, you can reach me at kyle@projectionlab.com, or @scuba-kid on the ProjectionLab Discord Server.


Disclaimer: The content, tools, and resources on ProjectionLab.com are intended solely for informational and educational purposes and should not be construed as professional financial or investment advice. Our materials are designed to provide general guidance and are based on the input and data provided by users. ProjectionLab makes no guarantee of the accuracy, completeness, or applicability of this content to individual circumstances. Effective financial planning and investment involve comprehensive consideration of a wide array of personal financial factors. The tools and resources available on ProjectionLab are aimed at helping users develop an understanding of their financial trajectory. However, they should not be solely relied upon for creating a complete financial plan. We strongly recommend consulting a financial services professional who can provide personalized advice based on your unique financial situation before making any significant financial decisions. While we endeavor to keep the information on ProjectionLab current and accurate, the content may differ from that found on other financial institutions, service providers, or specific product sites. All content and tools on ProjectionLab are provided without any guarantees or warranties of any kind.