What's New in v4.4.0
Flexible spending, deeper tax modeling, printable reports, and new ways to understand your plan.

Our latest release adds features and improvements that make your plans more adaptive, accurate, and similar to the real world.
You can now flex spending automatically when markets move, explore improved tax analytics, and model advanced strategies like the Mega Backdoor Roth. There are also plenty of smaller improvements that make planning smoother and insights easier to find.
Plans That Adjust When You Expect Them To
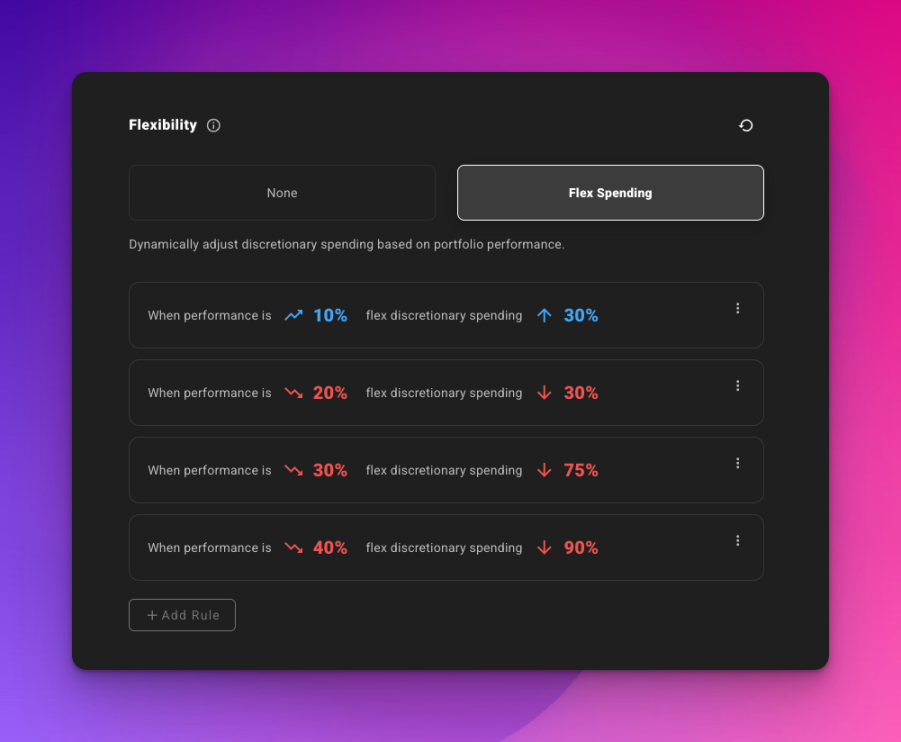
Flex Spending lets you set simple rules that automatically adjust your spending based on portfolio performance.
For example, you could tell your plan: “If the market drops 30% from its all-time high (ATH), reduce discretionary spending by 60%.”
You can tag expenses as Essential or Discretionary so only the expenses you want will adjust. The new Spending metric appears throughout your plan and Chance of Success charts, and it can also connect to milestones.
This makes it easy to include business or rental expenses in a plan while keeping them separate from lifestyle spending. You can also anchor milestones, like a FIRE goal at 25X Spending, and see how those adjustments affect your long-term projections.
Learn more: Read our Flex Spending Overview for setup and how it works.
More Accurate, Location-Based Tax Modeling
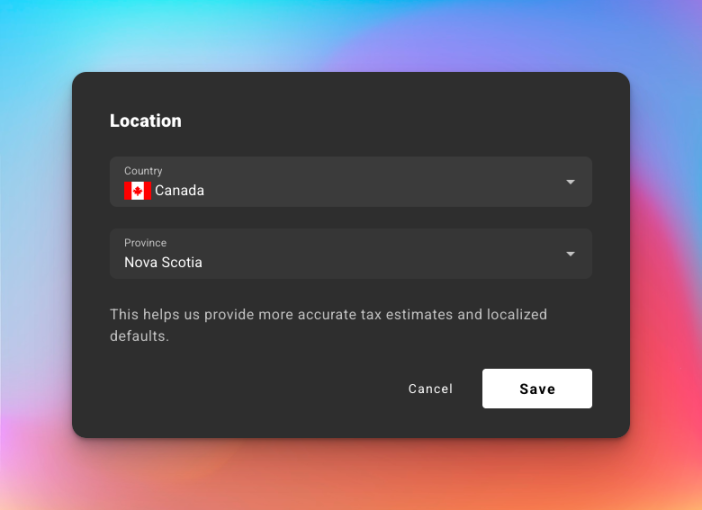
Your plan now takes location into account automatically.
Location is set during onboarding, so your plan starts with more accurate tax estimates and stays up to date.
You can scope credits and deductions by Federal, State or Province, and Local levels. In the U.S., that includes support for state-level itemization and phase-outs.
We’ve also improved international support:
- United Kingdom: Better handling of National Insurance and regional differences
- Canada: Added OAS, GIS, EI, CPP, and a configurable RRSP to RRIF conversion age
- Netherlands: More precise Box 3 wealth tax modeling
Existing plans are automatically mapped to likely locations, with tax modeling enabled when a strong match is found.
Note: Open your plan’s tax settings to confirm that location and tax are properly enabled.
Easier Ways to Explore and Export PDF Reports
Yearly summary metrics now include chart previews on hover, one-click plotting for any metric, and new metrics like State and Local Taxable Income.
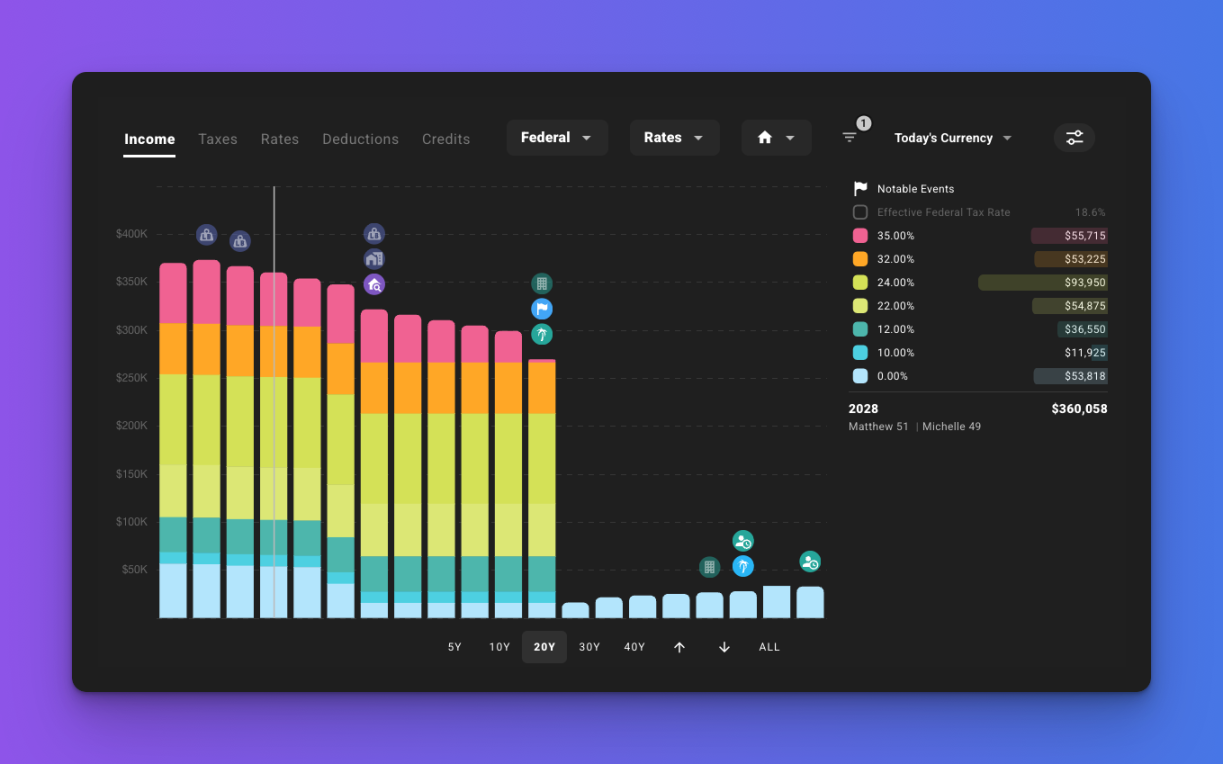
Tax Analytics has also been updated with a new Income by Tax Rate plot that uses heatmap color-coding to show how your income falls across brackets. You can filter by jurisdiction or type, such as Federal, State, or Local. The chart legend now includes hover interactivity and quick dataset toggles, making it easier to highlight the data you care about.
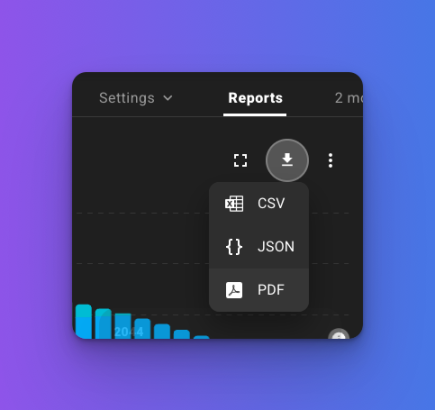
Tables now live in a new Reports tab, where you can view or export data to PDF, CSV, or JSON. This brings tables and exports together in one place, making it easier to explore and review the information you need.
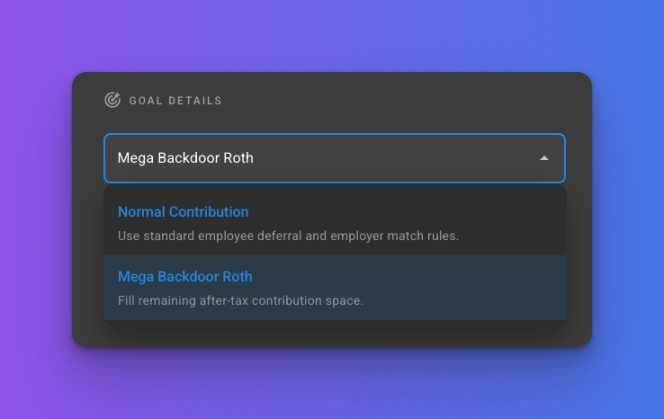
Advanced Strategy Modeling
You can now model a Mega Backdoor Roth directly in your plan. Choose to fill remaining after-tax space in a Roth 401(k) or 403(b), set fixed contribution amounts or percentages, and route funds either in-plan or by rolling them over to a Roth IRA.
More Robust Simulations
A new Block Bootstrap sampling method improves historical testing by mixing consecutive blocks of data while preserving real year-to-year patterns.
This approach lets you model more realistic market behavior instead of relying on fully random returns. You can explore how your plan performs through extended bull or bear markets, see how long downturns affect withdrawals, and understand the range of possible outcomes with greater accuracy.
Historical data through 2024 has been added, along with a smoother configuration experience.
Explore What’s New
ProjectionLab 4.4.0 helps you build plans that better reflect real life, from flexible spending and location-based tax modeling to more powerful reporting and simulations.
There are also many smaller improvements under the hood that make planning smoother and insights easier to find
Check out the full release notes or login to explore the new features in your plan.
Or if you would like a quick walkthrough, we put together a short video:

Disclaimer: The content, tools, and resources on ProjectionLab.com are intended solely for informational and educational purposes and should not be construed as professional financial or investment advice. Our materials are designed to provide general guidance and are based on the input and data provided by users. ProjectionLab makes no guarantee of the accuracy, completeness, or applicability of this content to individual circumstances. Effective financial planning and investment involve comprehensive consideration of a wide array of personal financial factors. The tools and resources available on ProjectionLab are aimed at helping users develop an understanding of their financial trajectory. However, they should not be solely relied upon for creating a complete financial plan. We strongly recommend consulting a financial services professional who can provide personalized advice based on your unique financial situation before making any significant financial decisions. While we endeavor to keep the information on ProjectionLab current and accurate, the content may differ from that found on other financial institutions, service providers, or specific product sites. All content and tools on ProjectionLab are provided without any guarantees or warranties of any kind.