Create a custom chart with Plot Builder
The built-in charts cover most questions. When you want to see two results together, make your own with Plot Builder. You might put income and spending on one chart to see when the gap between them changes.
On Plan > Overview, open the chart menu and select Your Plots > New Plot. Give the plot a name, then use Add Metric to choose the results to show. Once you have added the metrics you need, select Create.
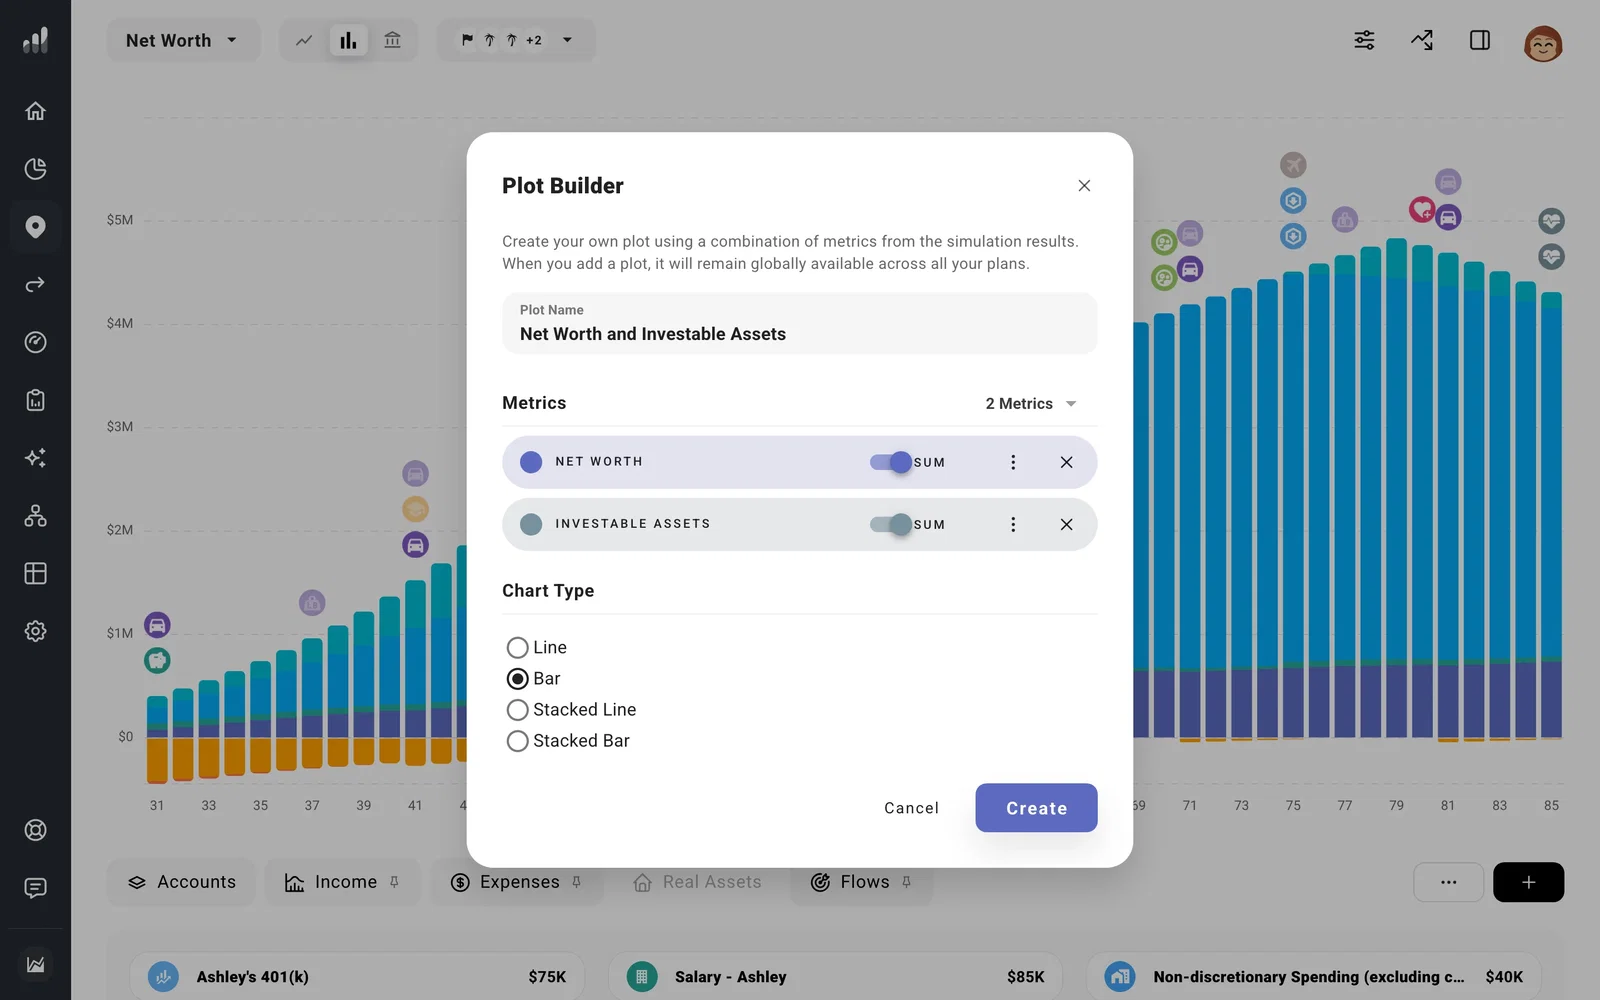
Each metric’s Sum switch shows its total. Turn it off to show the individual items within that metric, such as separate income sources. You can also adjust colors, chart type, and the order of your metrics in Plot Builder. If two currency metrics use very different scales, open a metric’s menu and turn on Use Secondary Currency Y-Axis to make both readable. Keep the chart focused: a few related metrics are usually easier to read than every result at once.
Your saved plot appears under Your Plots and is available in every plan. To edit or delete it later, open the chart menu and use the plot’s menu. Plan Overview explains how to select a year and read the numbers behind any chart.
