Run Chance of Success
Your plan’s forecast assumes markets grow at the rates you set, year after year. Real markets don’t. Good and bad years arrive in an unpredictable order, and a rough stretch right after you retire can hurt far more than the same stretch twenty years later. Chance of Success uses Monte Carlo simulations to run your plan through many different market histories, showing how often it holds up and what happens in the cases where it doesn’t.
How it works
Each run contains many trials. Each trial starts with your plan and plays it forward through a different sequence of stock returns, dividends, inflation, and bond returns. Your income, spending, taxes, contributions, and withdrawals respond along the way.
A trial succeeds if your plan reaches its end without running out of money. Running out means your income, the accounts you can draw from, and anything you’ve allowed the plan to sell can no longer cover the spending you need.
Run your plan
Open Chance of Success and select Run. The default settings are a good place to start. After you change your plan or the simulation settings, select the circular arrow beside your result to run it again. Your last result stays on screen until the new one finishes.
Choose how trials run
Open the gear beside your result to choose the market data, sampling method, and number of trials.
Data Sources
Choose where each trial’s returns and inflation come from.
Historical data replays real history: S&P 500 returns and dividends, and US inflation. If you hold bonds, bond returns use a historical mix of 75% government and 25% corporate bonds. Each sampled year brings its stock returns, dividends, inflation, and bond returns together, so a year like 1974 arrives with both its market losses and its high inflation.
Normal Distribution draws returns from a range you set with an average and a standard deviation. Use it to test a future that’s better or worse than history, such as lower average returns. Cryptocurrency, if your plan holds any, always uses a range you set.
You can mix the two, for example historical stock returns with your own inflation range.
If you’ve given an account its own growth rate, you choose on that account whether it varies in trials or stays fixed. All other accounts follow the market data you choose here.
Methodology
With historical data, the sampling method decides how years of history are strung together into a trial:
| Method | How it works | Good for |
|---|---|---|
| Historical, Random-Restart (default) | Starts once from every year in history and plays forward. When history runs out, it jumps to a random year and continues. | A thorough look at every historical starting point |
| Historical, Block Bootstrap | Builds each trial from random blocks of consecutive years. Block Length sets how long each block is. | More variety while keeping realistic runs of good and bad years |
| Historical, Looping | Starts from every year in history and loops back to the earliest year when it runs out. | A simple, repeatable replay of history |
| Historical, No Looping | Uses only starting years with enough history ahead of them to cover your whole plan. | Testing only against unbroken real history. Long plans get fewer trials. |
| Random Start, Random Loop-Back | Starts in a random year, plays forward, and jumps to another random year when history runs out. | Many trials from a random mix of starting points |
| Random Years, Non-Chronological | Picks a random year from history for every year of your plan. | The widest variety, without runs of good or bad years |
Depending on the method, you can set Number of Trials, or Historical Iterations to repeat the full set of historical starting years.
Random Sequences decides whether trials repeat between runs:
- Automatic (default) uses the same market paths every time, across all your plans. When you change your plan and run again, any difference comes from your change, not from a different set of markets.
- Custom Seed lets you choose a repeatable set of paths yourself.
- New Sequences Each Run draws fresh paths every time, so results move a little from run to run.
Metrics, outcomes, and labels
Metrics chooses which numbers each trial records for the charts, such as net worth, spending, taxes, and withdrawals. Recording fewer makes large runs faster.
Outcome Categories and Success Rates set how results are grouped and labeled. You can rename them and change where their lines fall. This changes how results are described, not the results themselves.
Read your results
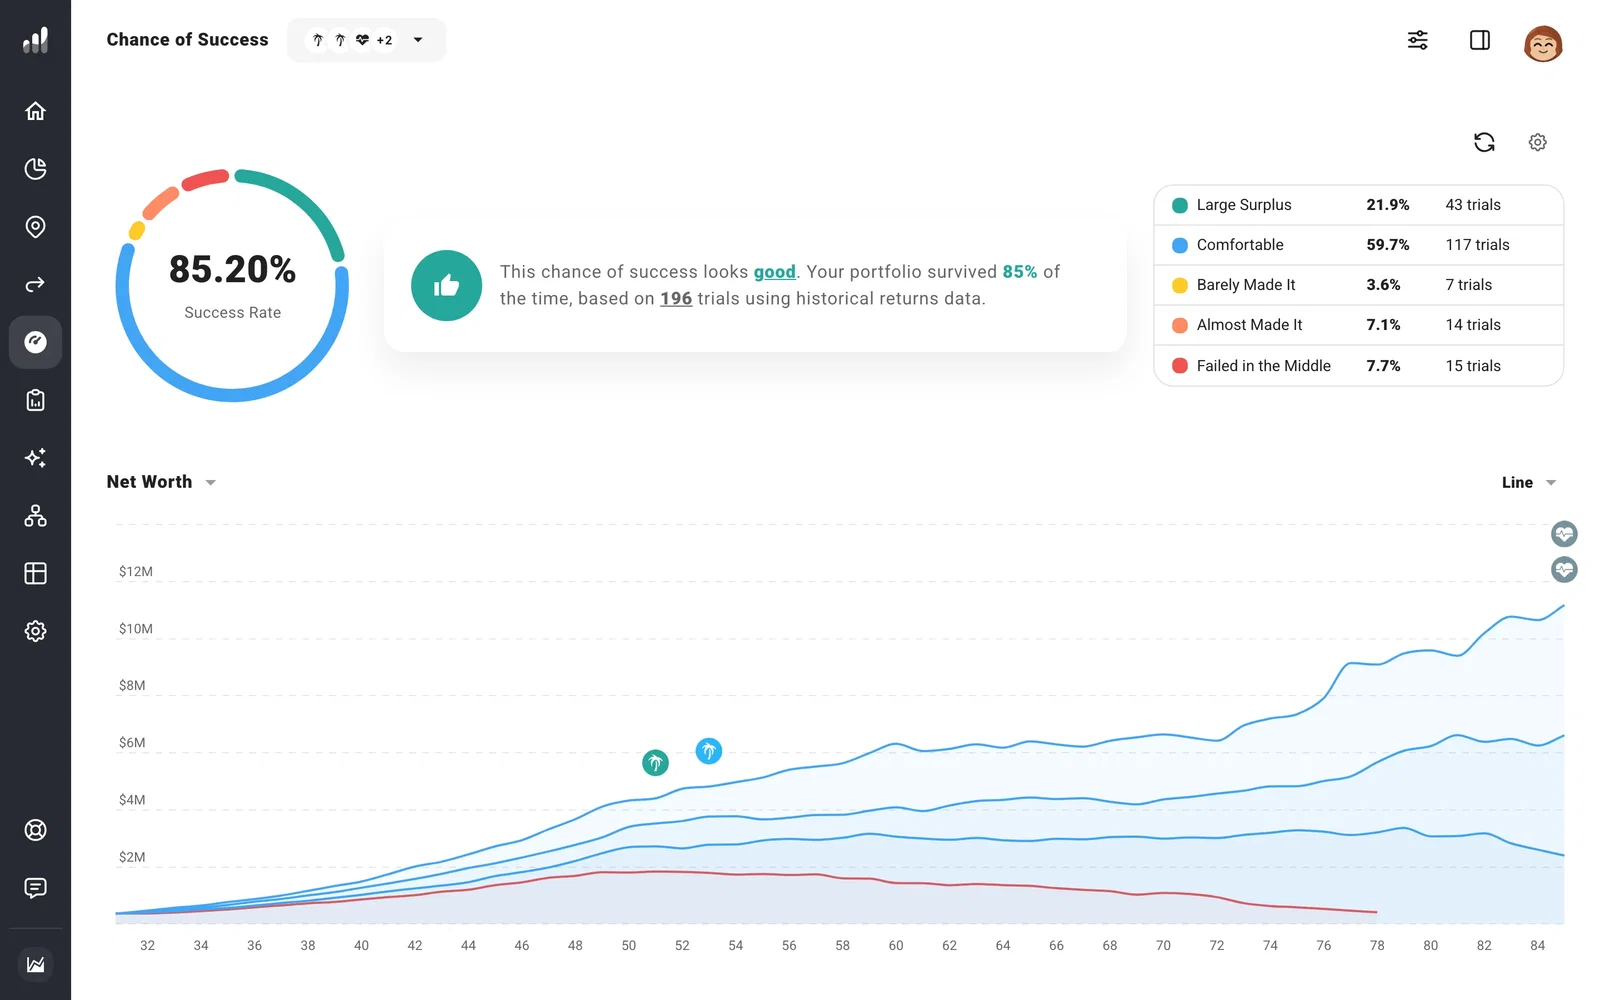
Your success rate is the share of trials that reached the end of your plan. An 80% Success Rate means 20% of trials ran short if you never changed course. In real life, you would. Those trials show where you might need to be flexible, and you can open any of them to see the chart and year-by-year details.
Beside it, your trials are grouped by how they ended. Successful trials are grouped by how much they left at the end compared with your net worth at retirement. Trials that ran out are grouped by how early it happened. Select a group to see only those trials.
Switch the chart between net worth, spending, taxes, and withdrawals to see where the trials spread apart. Line shows percentiles, including the median and the worst 10% of trials; Fan shades the range between them. Select a year to see the spread in that year, or select a range to narrow the trials shown.
If your retirement depends on reaching a savings target, Milestones shows how often you reached it and the range of ages when it happened. You can view the timing by age or by year.
To see your finances around a milestone, choose a metric such as net worth and a milestone such as retirement. The statistics show the median, average, smallest, and largest values before and after it.
In Trials, open a trial to see its chart and year-by-year table, including the market year, returns, and inflation. A trial that ran short can show, for example, how a crash around retirement affected the years after it.
Make your plan more resilient
- Set up Flexible Spending to spend less after a downturn. It responds to each trial’s own market, so it can help in the trials that need it most.
- Change one thing, such as your retirement date or spending, and run again. With Automatic sequences, the new result is a fair comparison with the old one.
If something looks off
My success rate changed without a plan edit
Check Random Sequences. New Sequences Each Run draws new market paths each time; Automatic repeats them. A change to the simulation settings can also change the result.
A small change made my success rate fall sharply
Open a trial that ran out and check the year it fell short. Its year-by-year details can show how that change affected the years after it.
The trial count is different
Check Methodology. Some historical methods use every starting year; Historical, No Looping uses fewer as your plan gets longer. Historical Iterations can increase the count.
