Explore a year in Tax Analytics
Why are taxes higher in one year, and what would another withdrawal or conversion do to them? Tax Analytics shows the income, taxes, deductions, and credits behind your plan, with a closer look at any year.
Find the years worth exploring
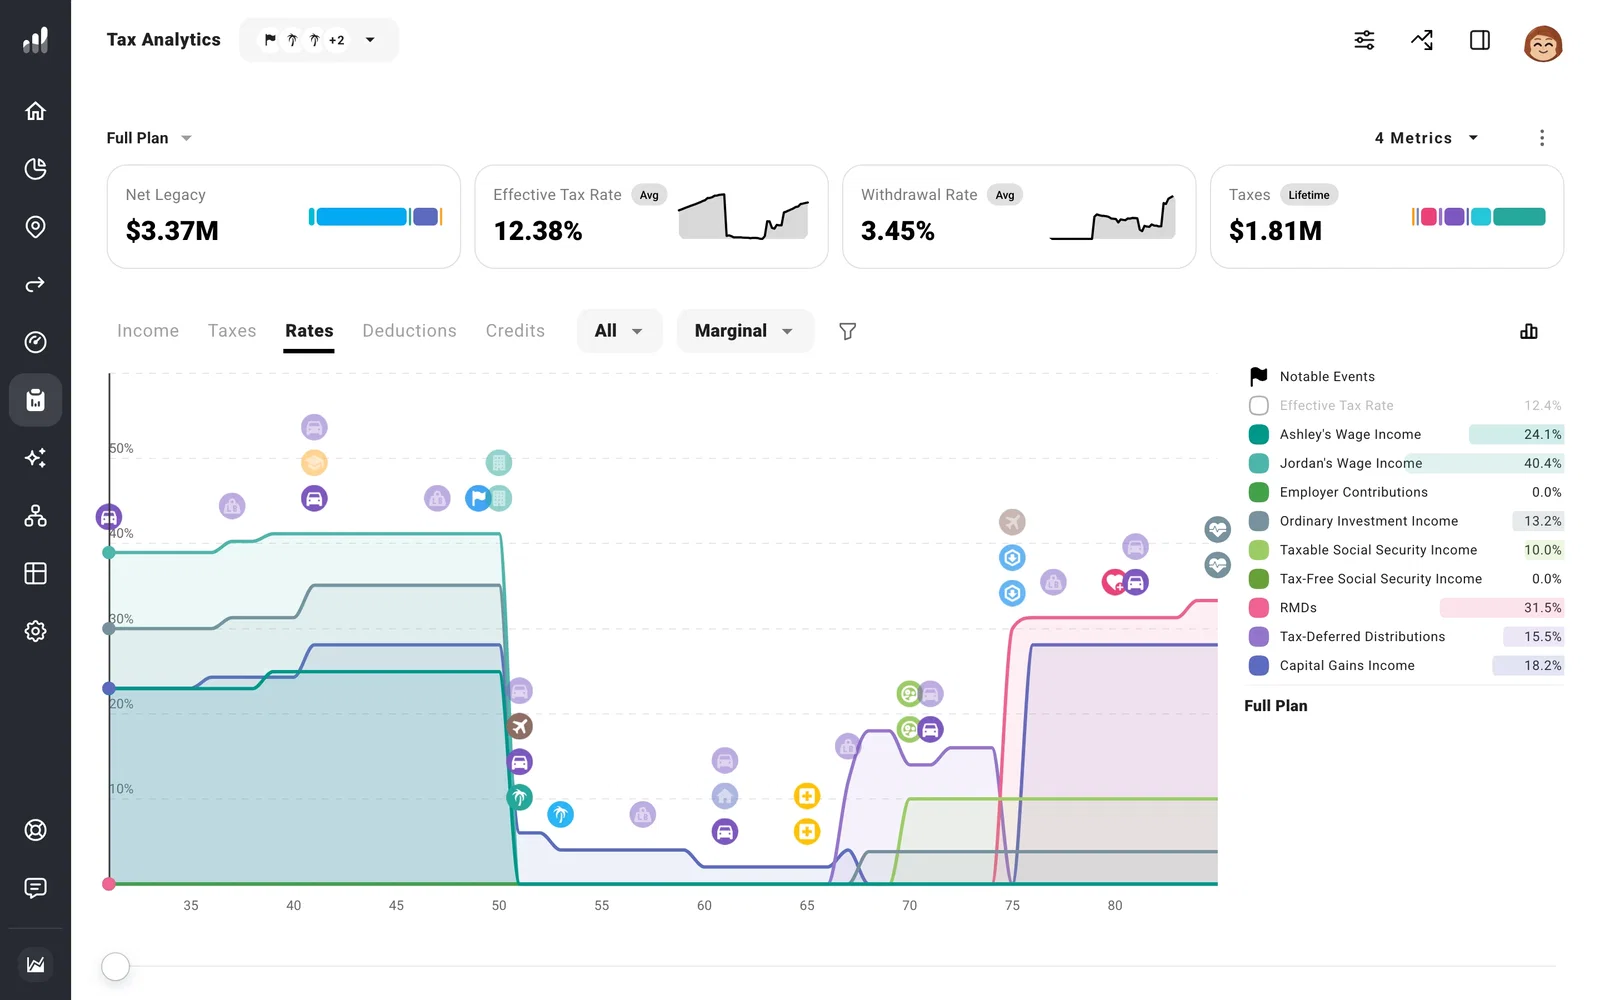
Open Tax Analytics. Switch the chart from Income to Taxes, Rates, Deductions, or Credits, depending on your question. The list beside it shows what makes up that result. Use the jurisdiction choices to look at federal, state, or local taxes separately where they apply.
In Rates, Marginal is the rate on additional income. Effective is the average tax rate on that income type. Entering a higher bracket changes the rate on the next portion of income; it doesn’t apply that higher rate to everything you’ve earned.
Look at a year before changing your plan
Move the year slider beneath the chart to the year you want. Change Full Plan to Selected Year at the top if you want the result cards to show that year too.
Brackets shows how the income fills each bracket, with a table of income, tax, and what remains after tax. For tax credits, switch the main chart to Credits.
Progression shows the rate on more income of each type, starting from that year’s position. It helps you spot where an extra conversion or withdrawal crosses a bracket. Use Compare > What If to test the full effect when the extra income also changes other taxes or benefits.
To change an event behind the tax estimate, open Events at the top right and edit it in the Events panel without leaving Tax Analytics.
Make a useful rate comparison
The Effective Tax Rate card uses the taxes and income included in your metrics settings, which can be broader than a rate on your tax return. The Brackets table shows tax attributed to its income types. If you want a different definition for the card, choose what your plan metrics include.
Next: Set up a Tax Strategy
