Use Plan Overview
Plan Overview shows your whole plan year by year, with retirement and other milestones marked along the way, and lets you change it as you go. Open it from Plan > Overview.
Look closer at a year
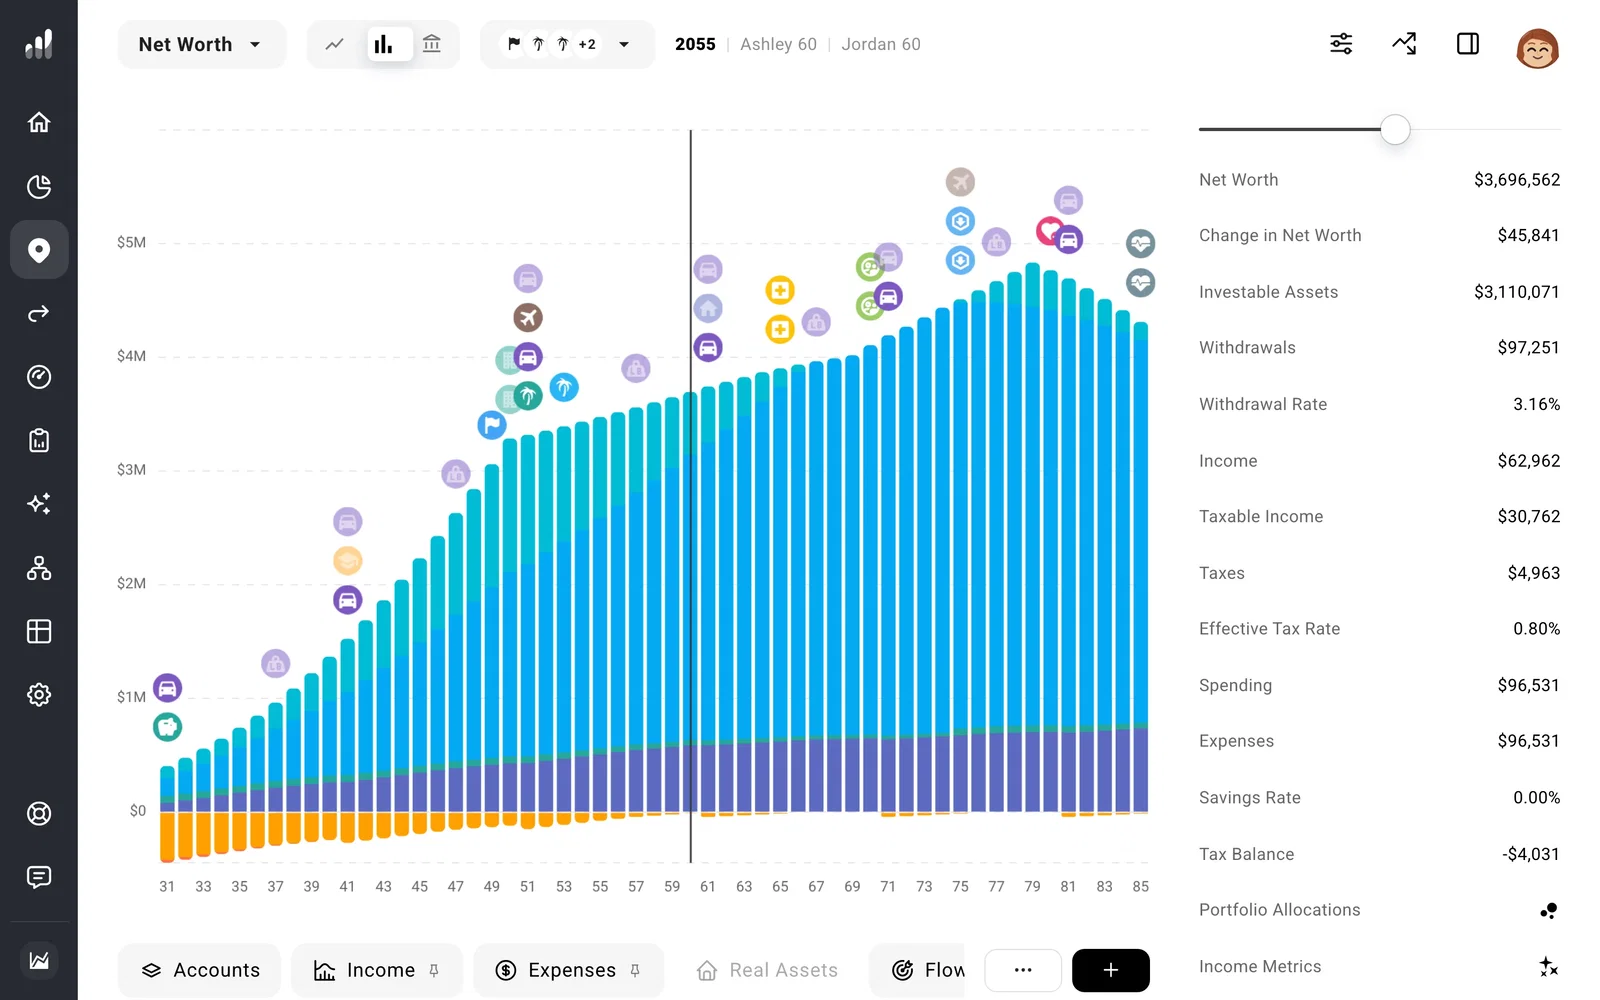
Select a year when you want to know what’s behind a change in the forecast. Show metrics gives you that year’s income, spending, taxes, and net worth; expand a figure to see what makes it up. Hover over a year for a quick summary without selecting it.
Change the chart
Along with your total net worth, switch to By Account to see each account grow and get spent down, By Category to see cash, investments, retirement accounts, and property separately, or Balance Sheet to see everything you own next to everything you owe. Open the chart menu for income, spending, taxes, withdrawals, and many more.
If you’d like a chart of your own, build one with Plot Builder.
Today’s money or future money
By default, amounts are shown in today’s money, adjusted for inflation, so a number 30 years from now means what it would buy today. To see the actual future amounts instead, open Display Options and turn off Adjust for Inflation. Display Options also lets you zoom in on part of your plan with a time range, and choose which milestones appear on the chart.
Make changes as you go
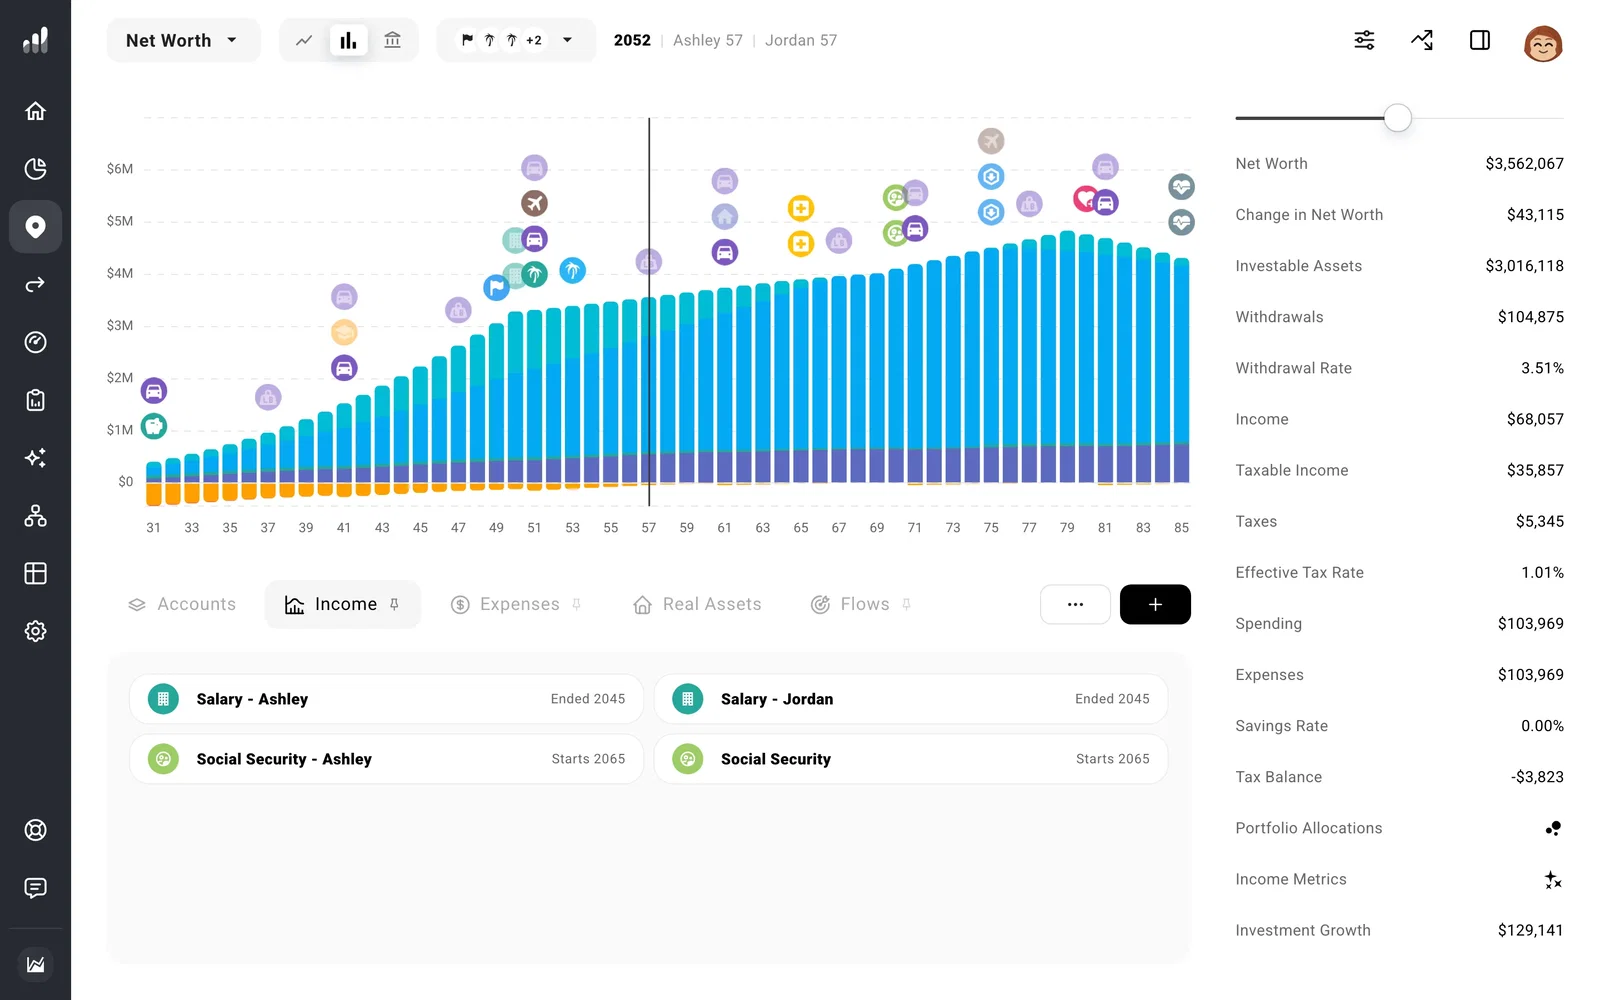
Below the chart, open Accounts, Income, Expenses, Real Assets, or Flows to change what’s in your plan. You can pin more than one section open, such as Expenses and Flows.
Try a what-if
To test a change, such as retiring two years earlier, select Plan > Compare > What If and make it. Your original plan stays on the chart as a dashed line. See Compare.
Next: Run Chance of Success
