Explore ProjectionLab
ProjectionLab brings your whole financial life into one place so you can see how everyday choices shape your future. This tour introduces the main pages and shows you where to find things.
Home
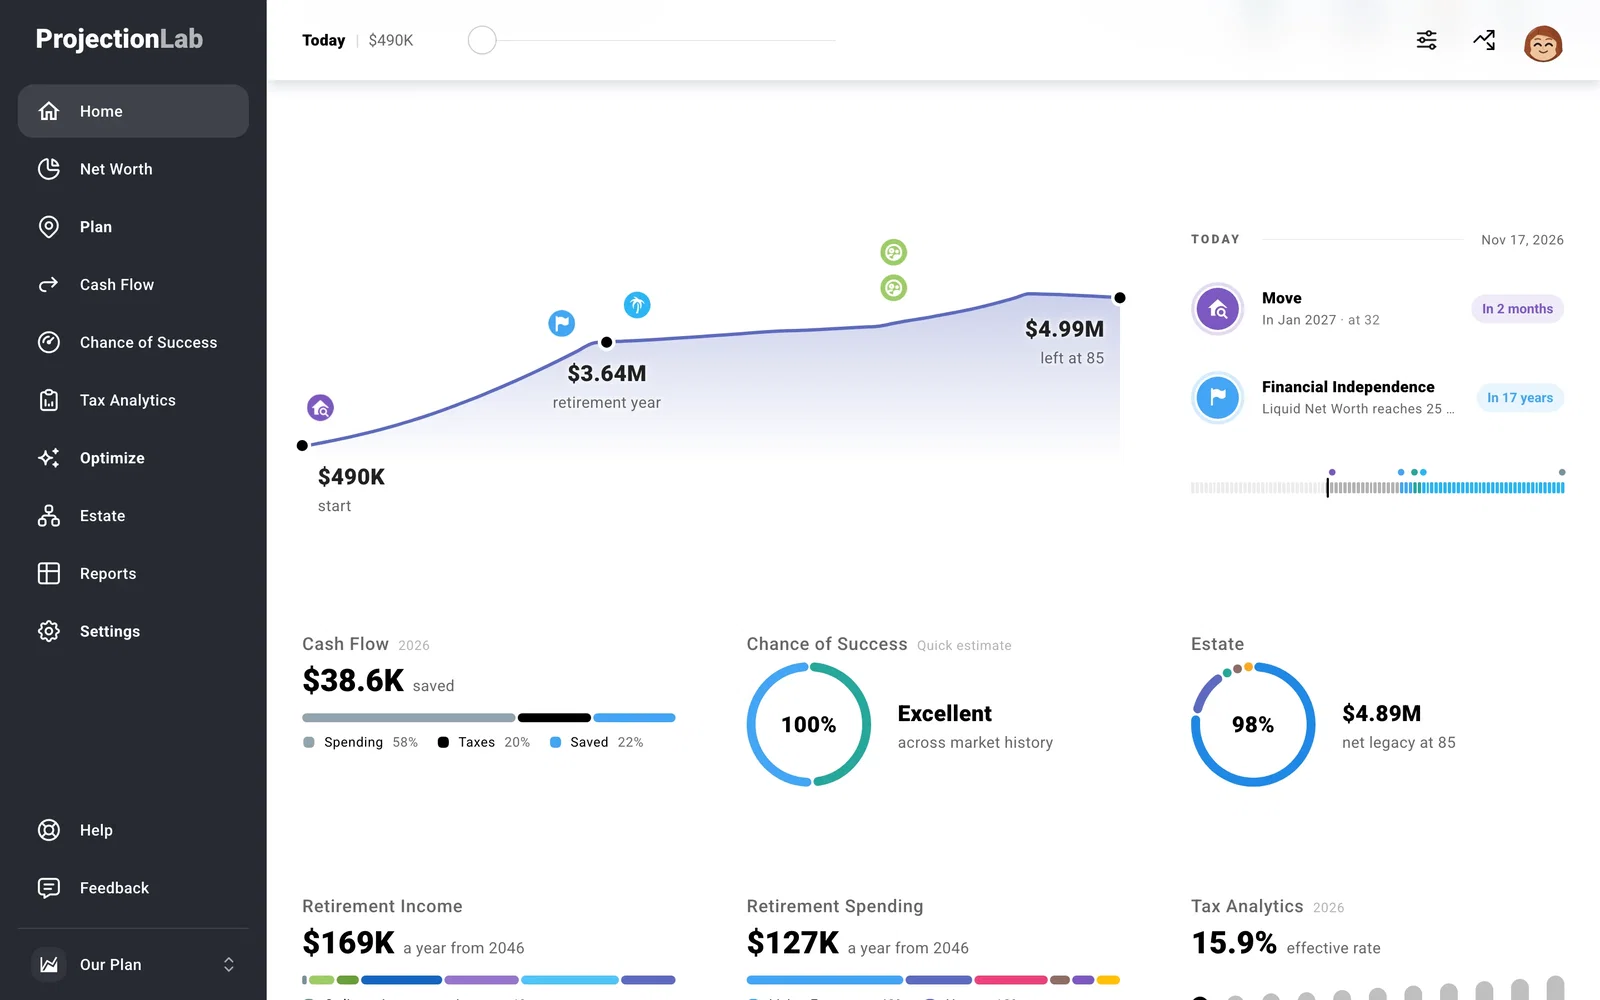
Home is an overview of your plan. Move through the timeline to see a summary for each year, or drill into any section to navigate to that page. If you have just finished setup, review your first plan here.
Current Finances
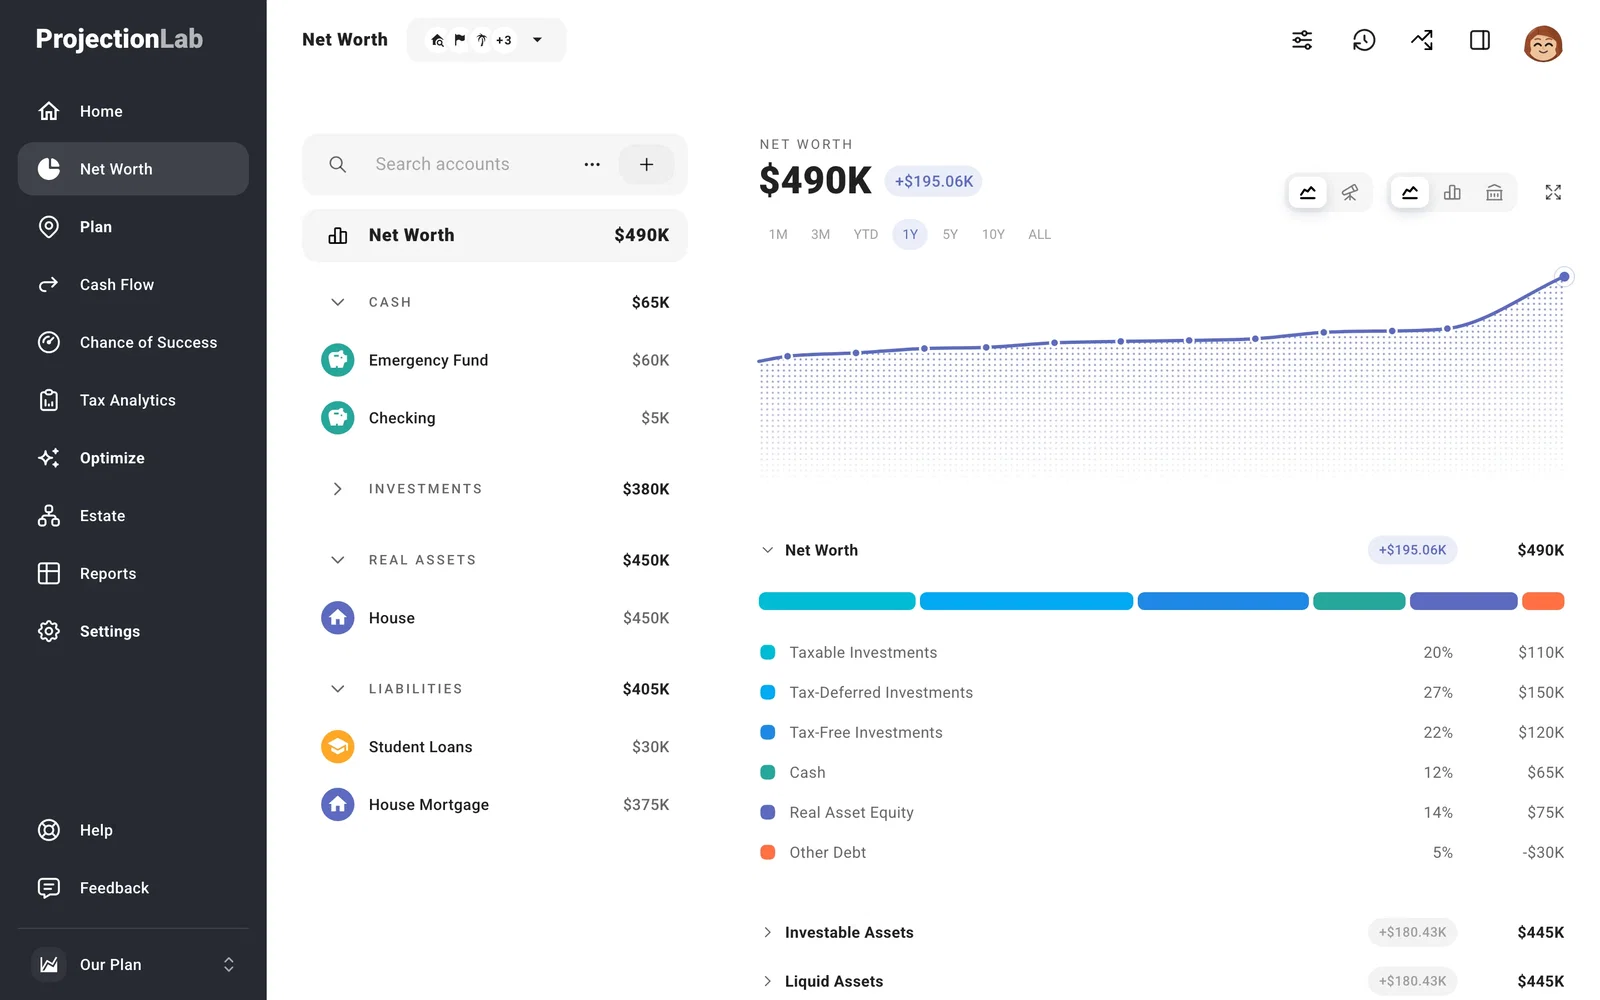
Use Net Worth to track what you own and owe. See your accounts, property, and debts in one place, update balances, and look back at how they have changed.
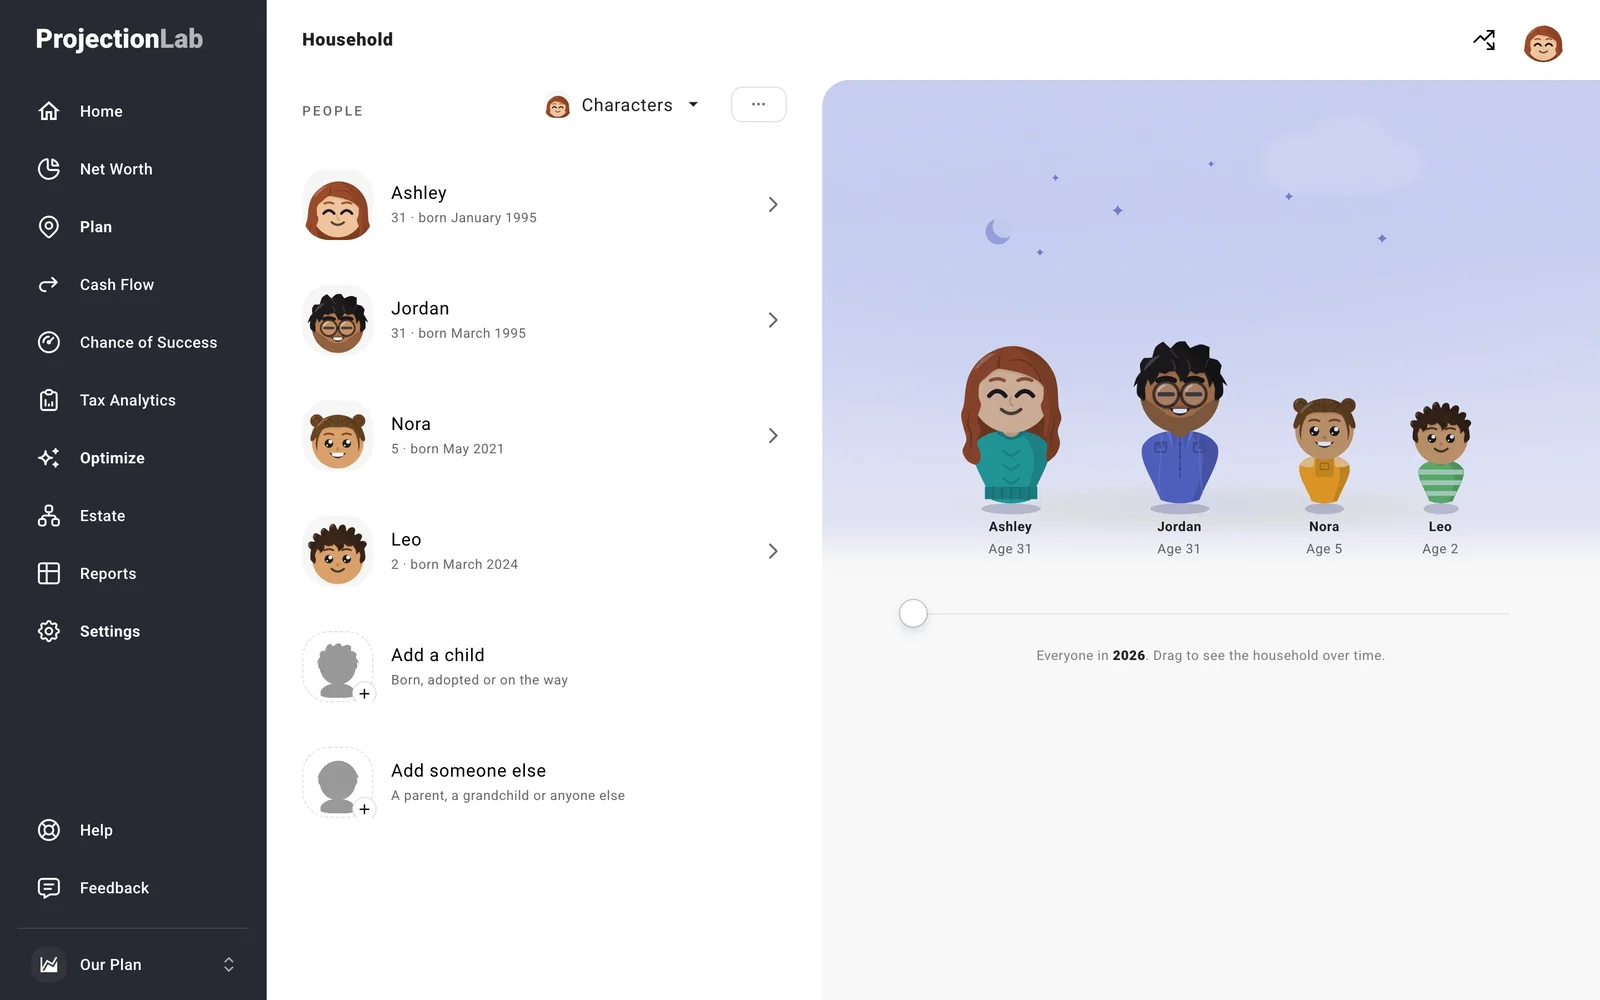
Use Household to add people to your plan, including partners, children, and anyone else you’re planning for.
Build and edit your plan
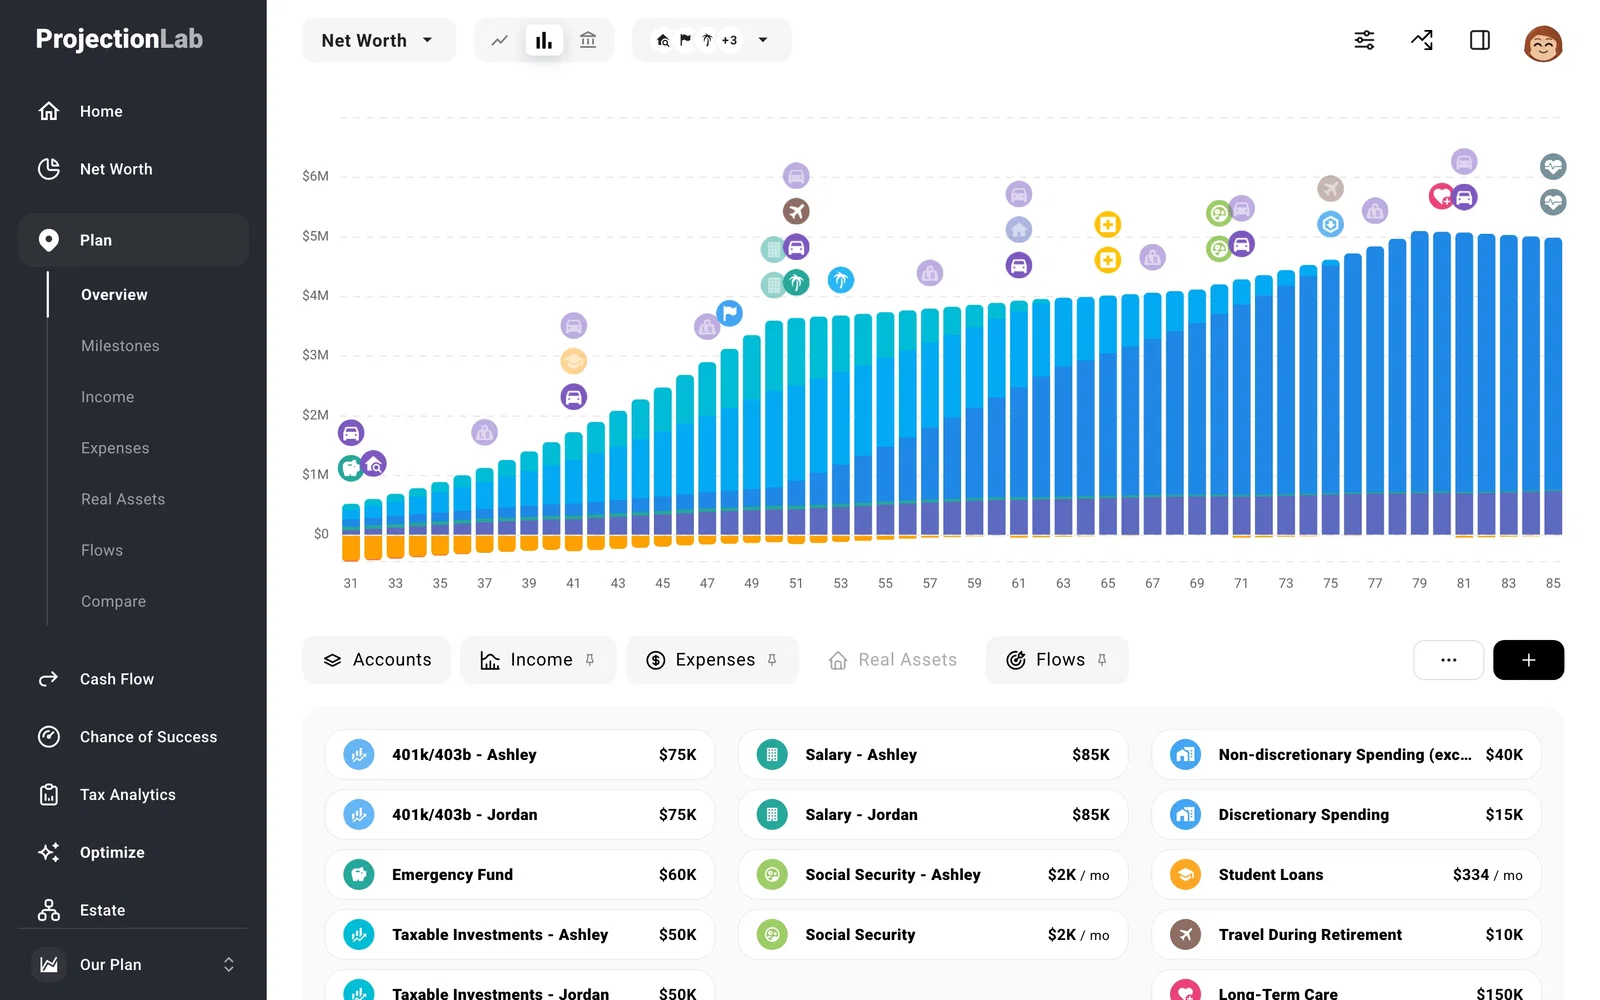
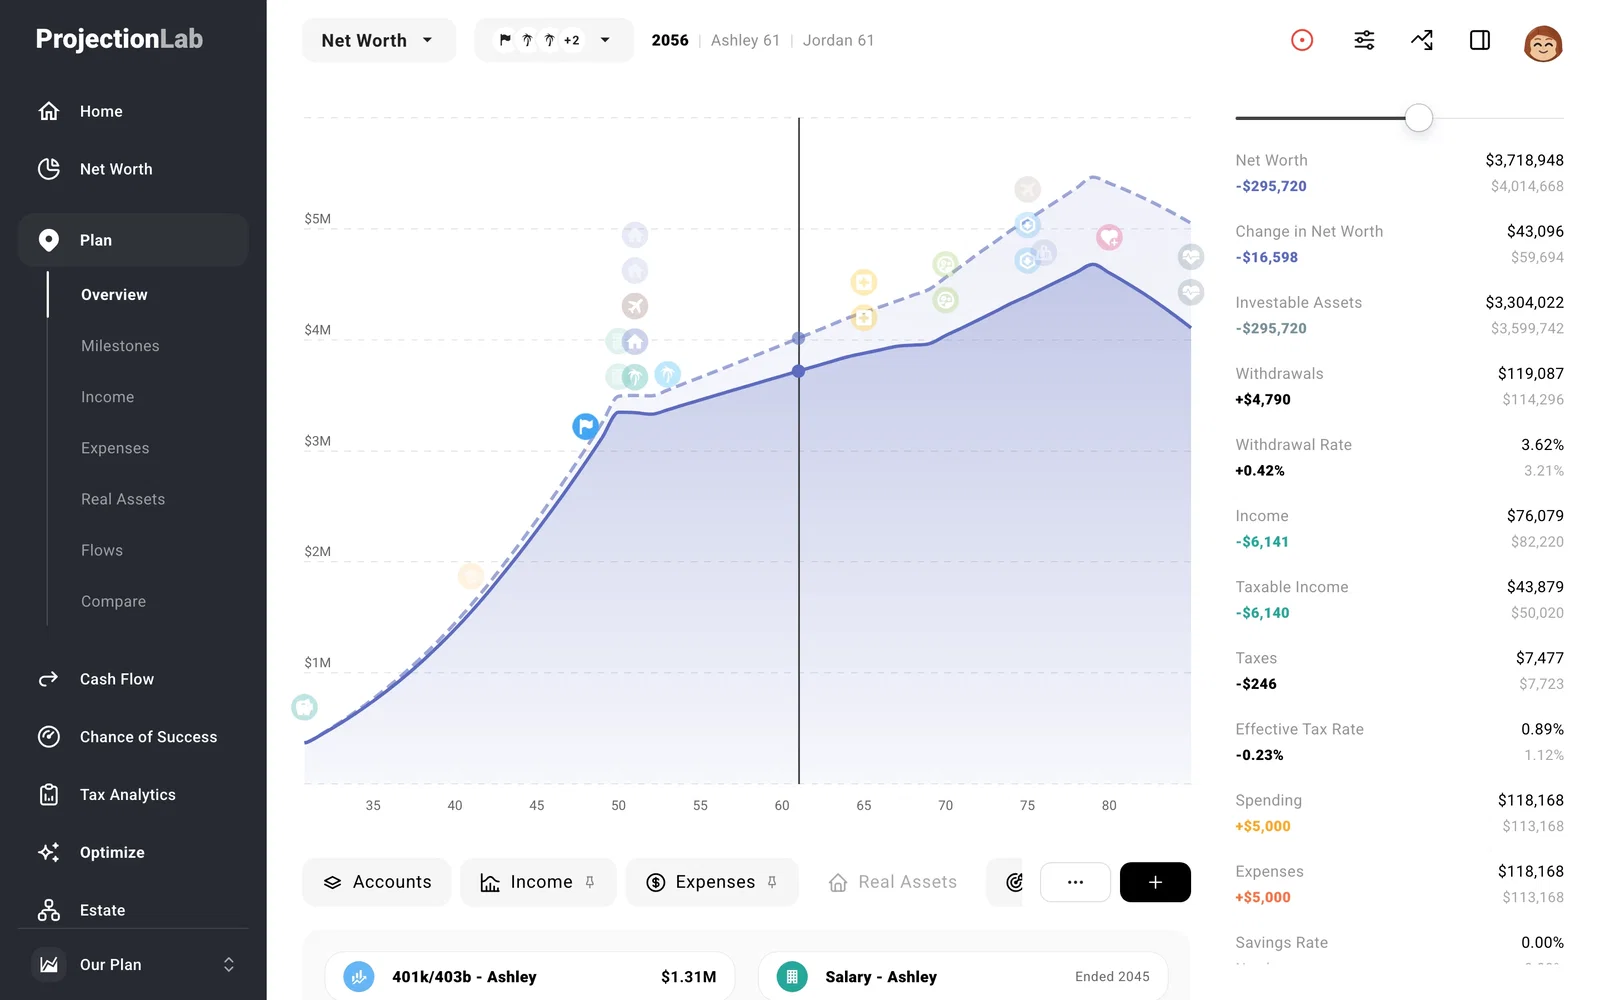
Plan > Overview is your financial roadmap. Move through the years to see how income, spending, saving, and major life events shape the forecast. The pages beneath Plan are where you add the details. See how to review and edit a year.
Milestones
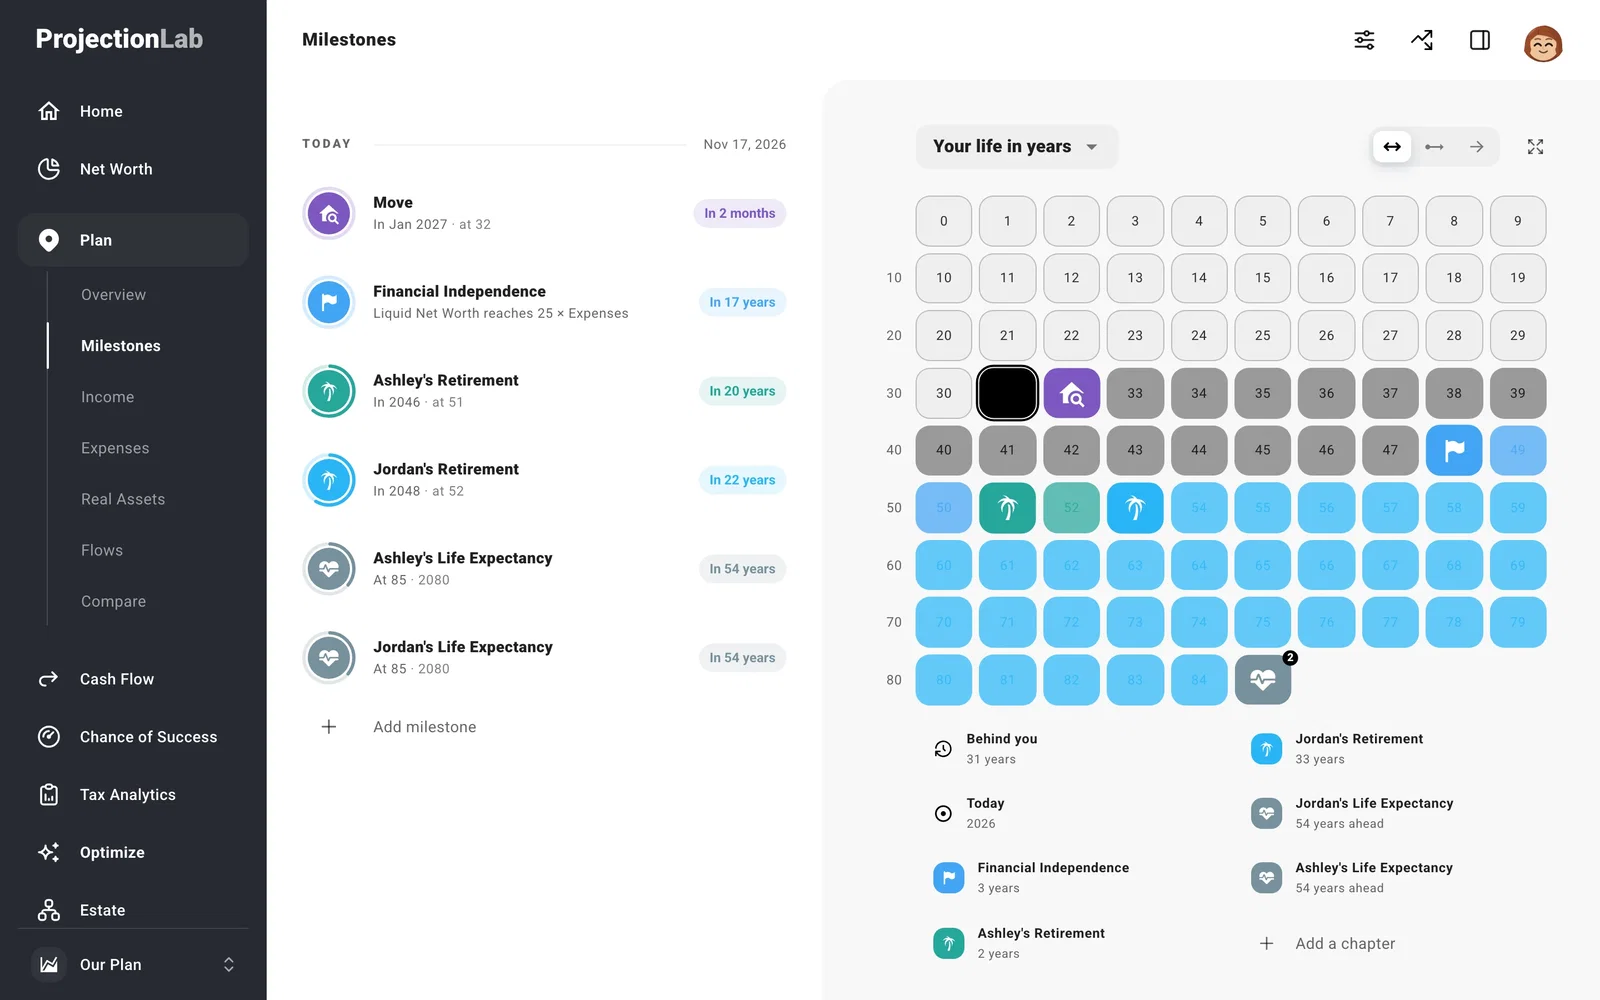
Use Milestones to add and time the big moments you want to plan around, from retirement to life expectancy.
Income and Expenses
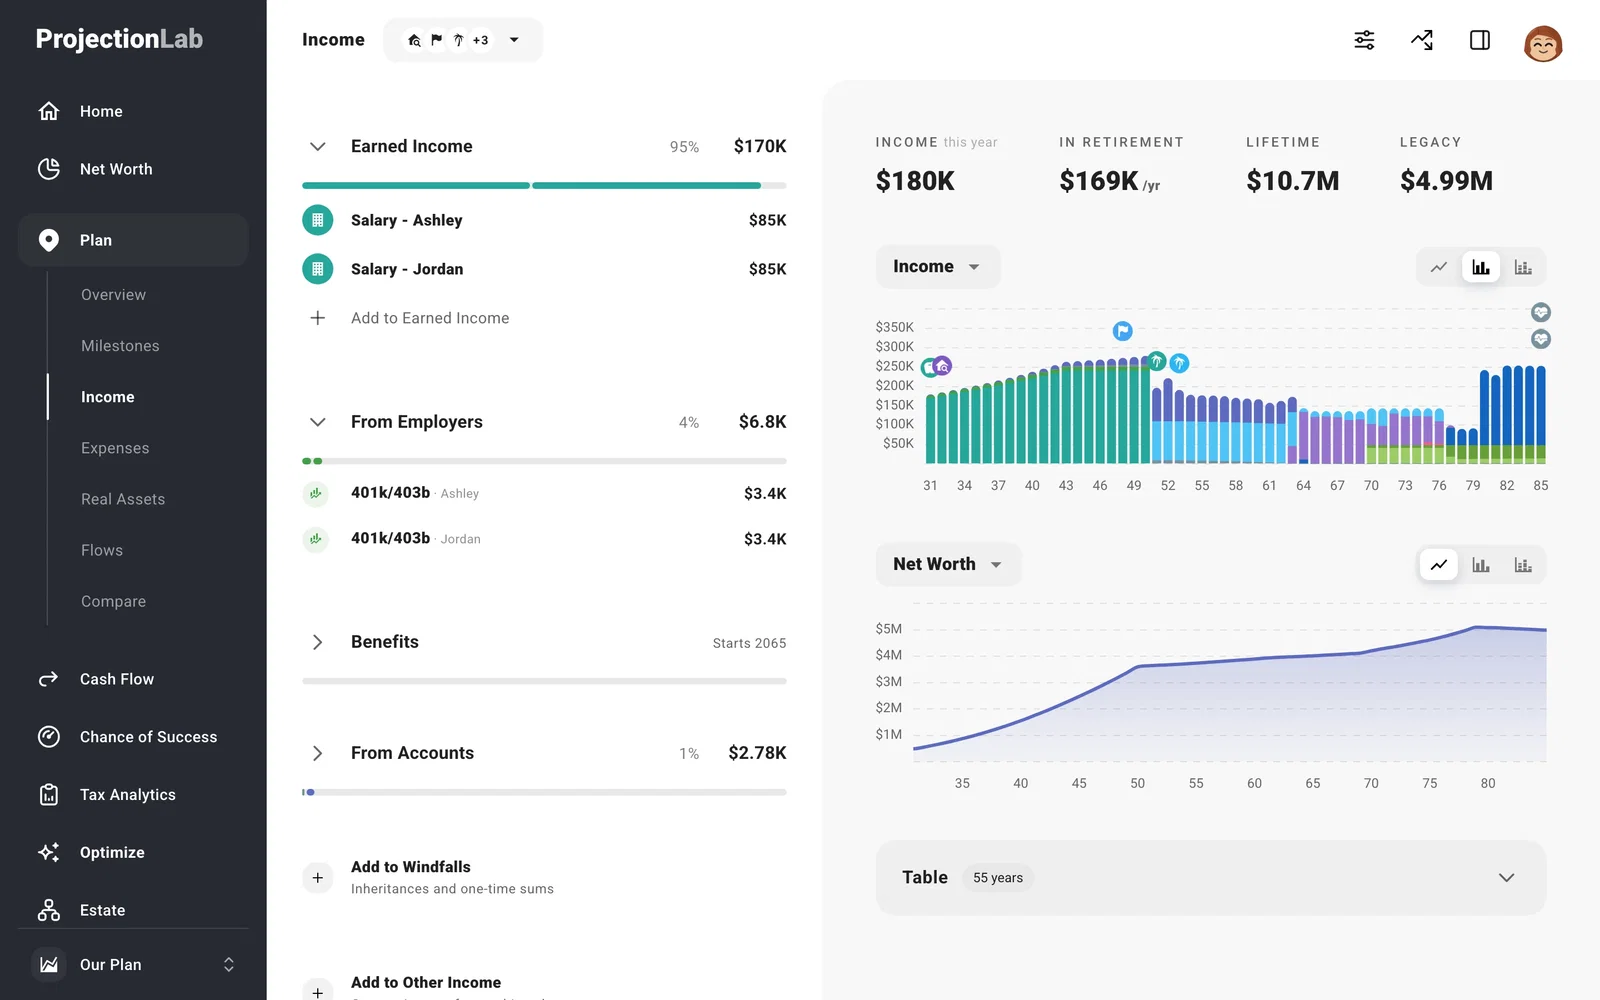
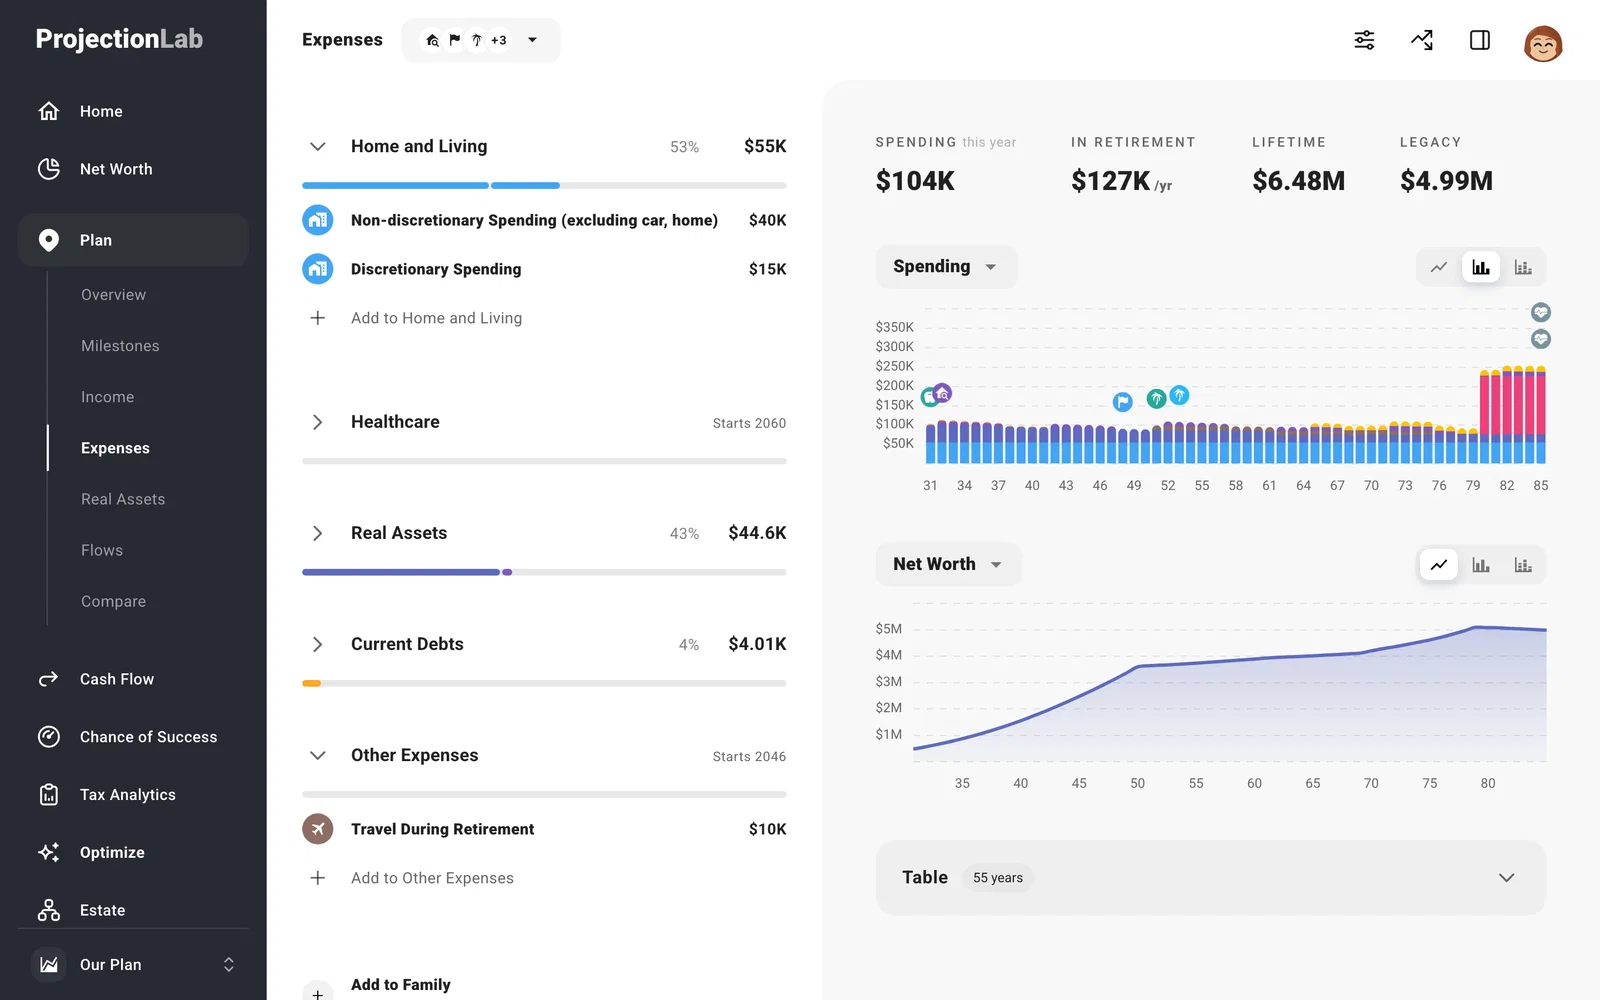
Income is where you add what comes in and when it changes. Expenses is where you plan what goes out, now or later.
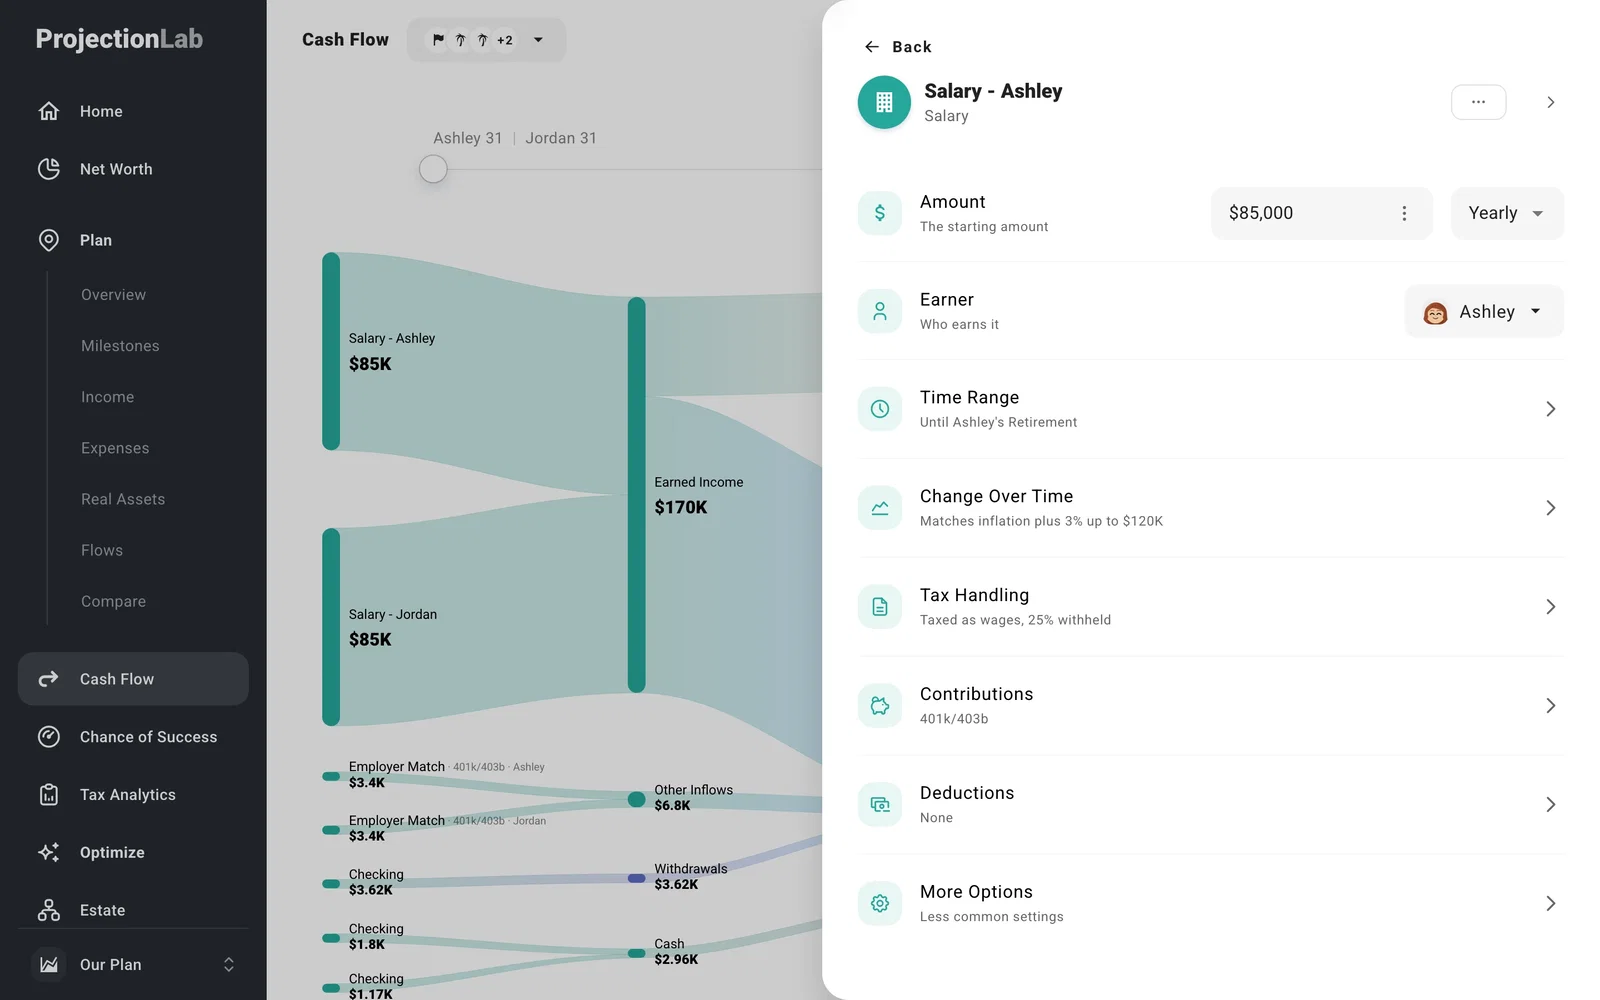
You can also change an income or expense from results pages such as Cash Flow and Tax Analytics. Select Events at the top right to edit it in the Events panel without leaving the chart you’re looking at.
Real Assets and Flows
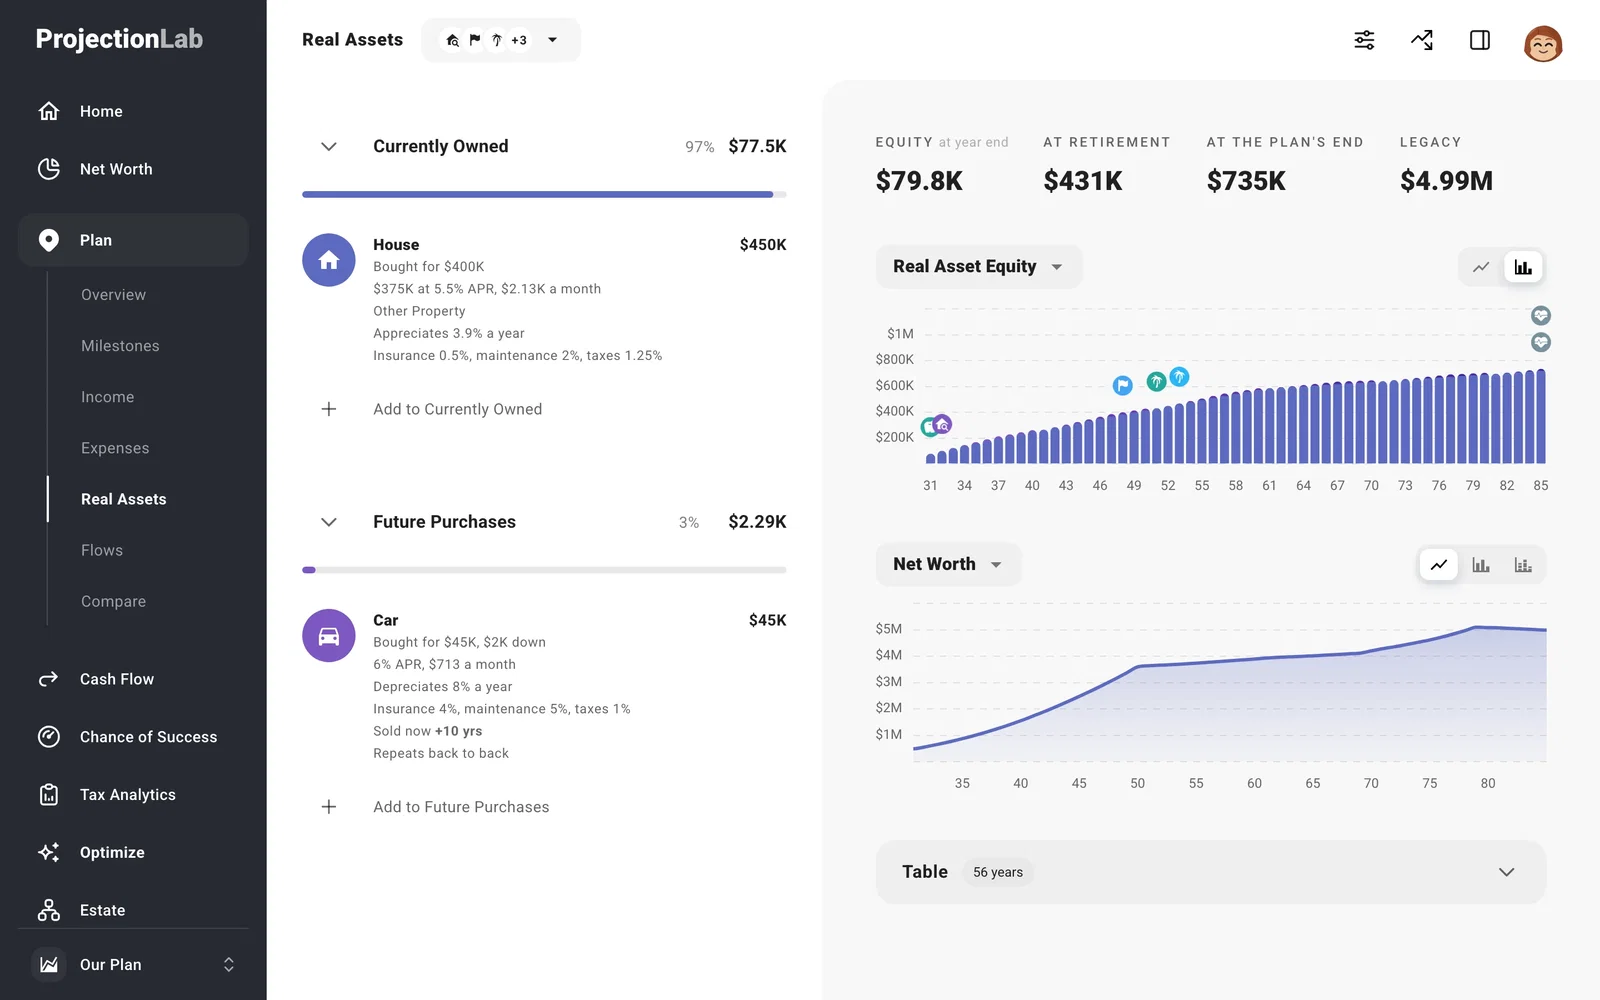
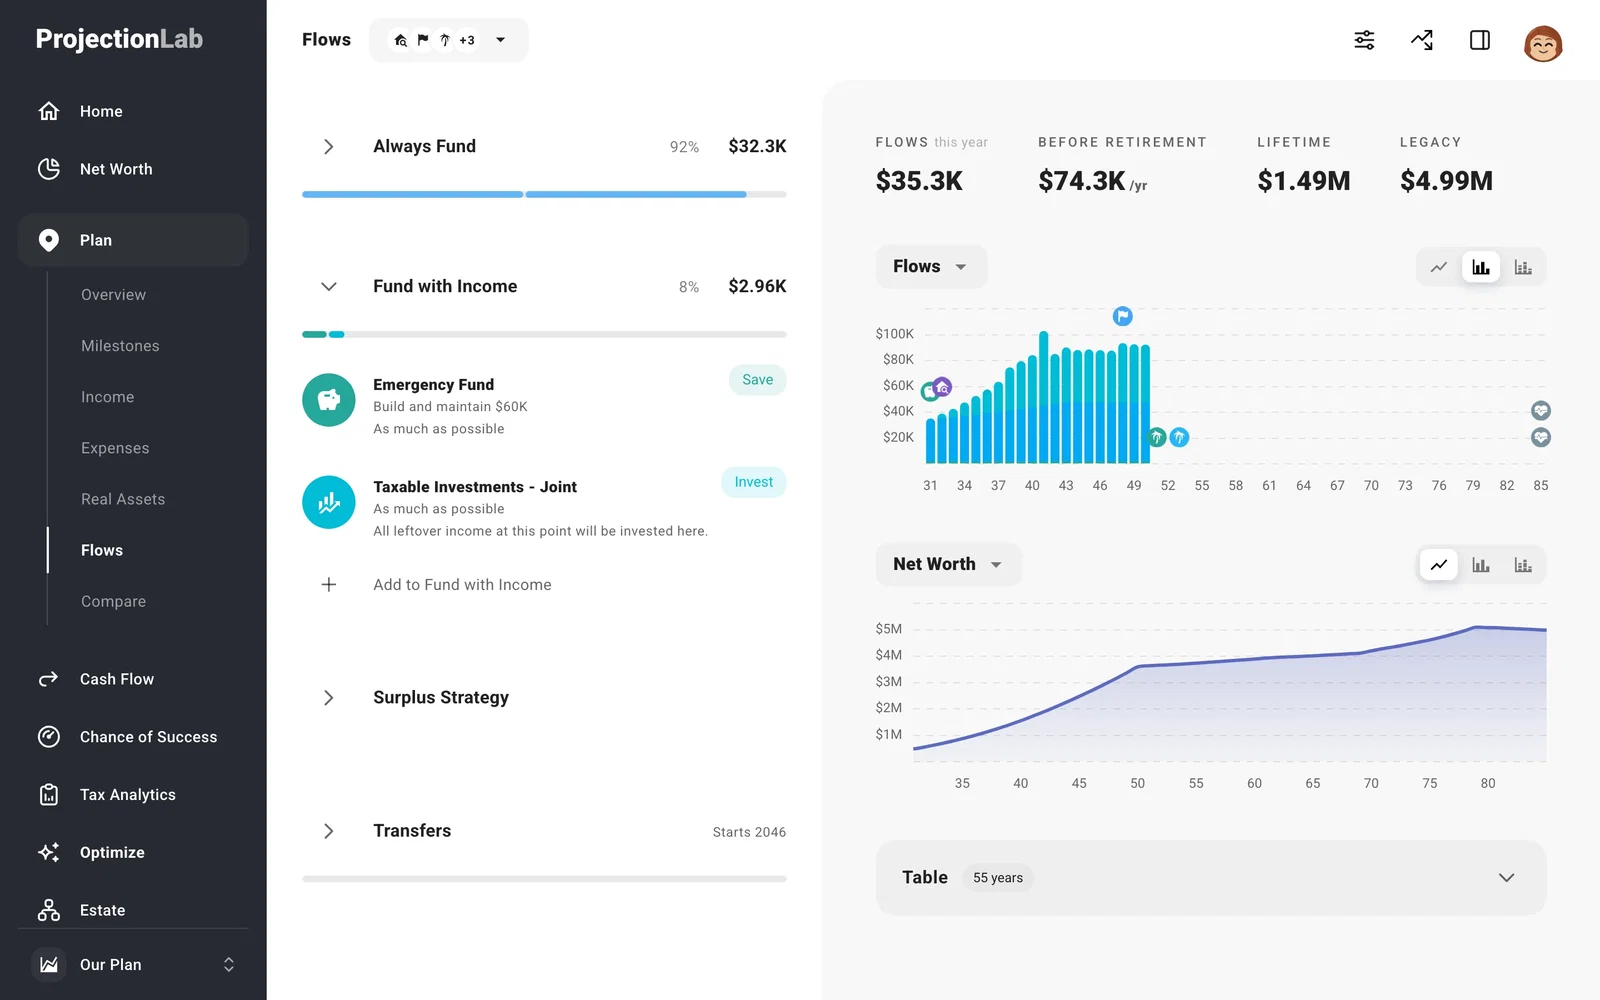
Use Real Assets to plan a future purchase or the sale of property you own. Use Flows to direct money to accounts, build cash reserves, make transfers, and pay down debt.
Compare > What If lets you test changes without touching your saved plan. You can also compare two saved plans against each other. Learn how Compare works.
See how your plan plays out
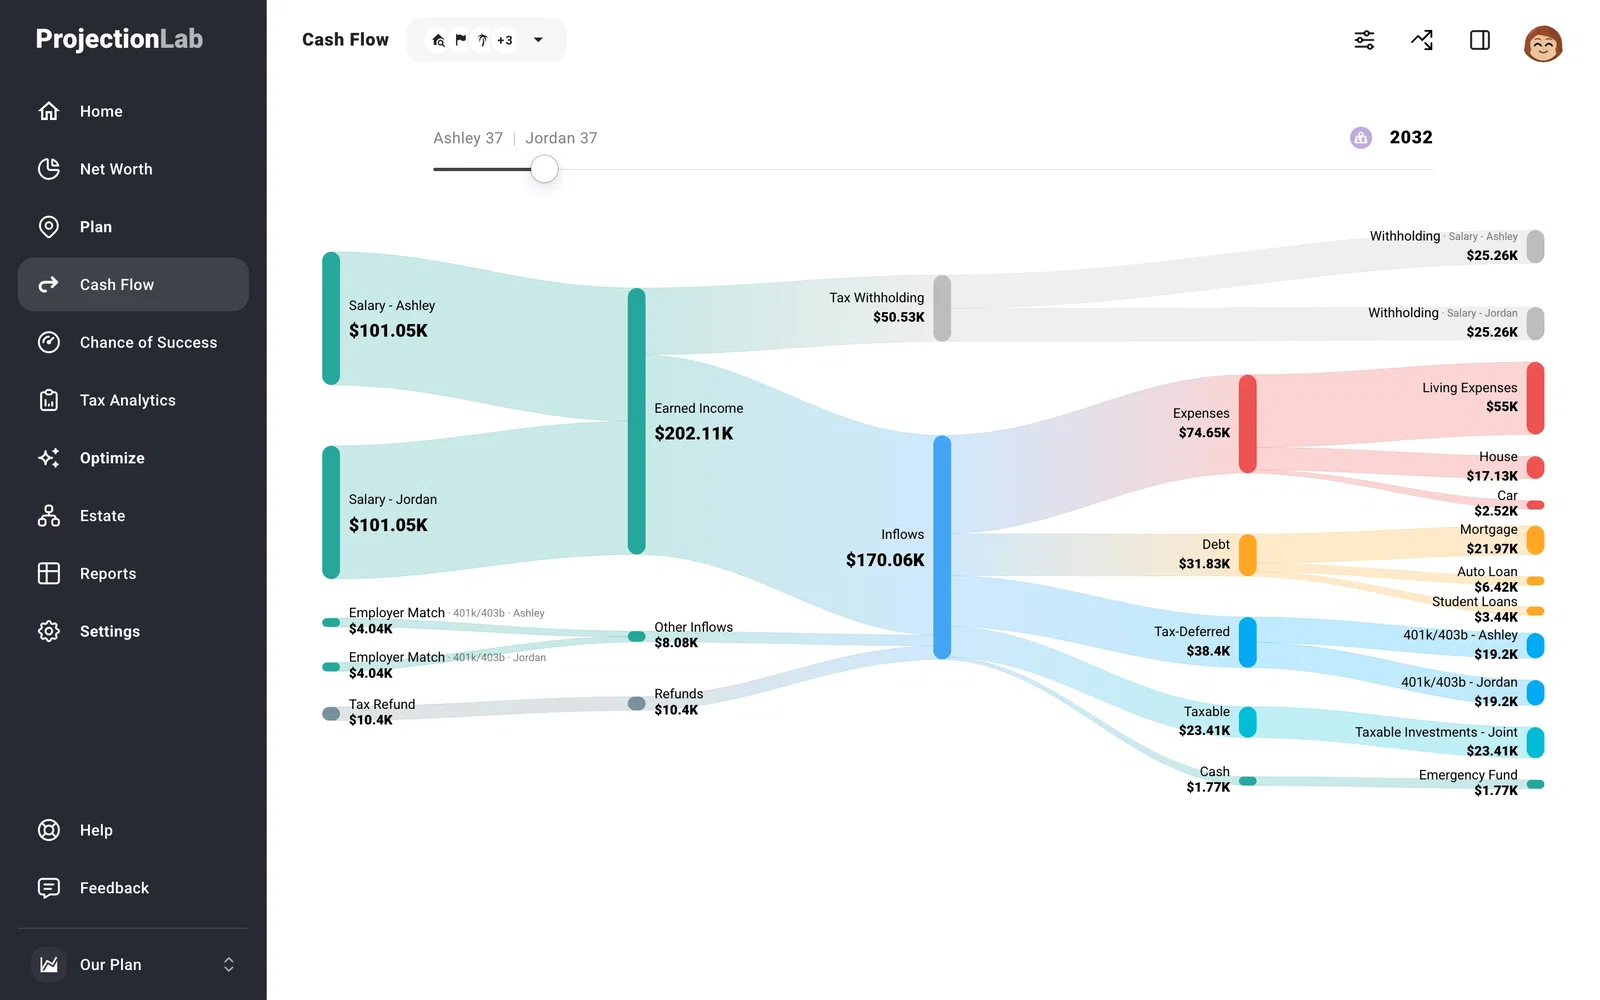
Cash Flow shows where money goes in a particular year, from income through taxes, spending, debt payments, savings, and withdrawals. Follow the money through the chart if a result surprises you.
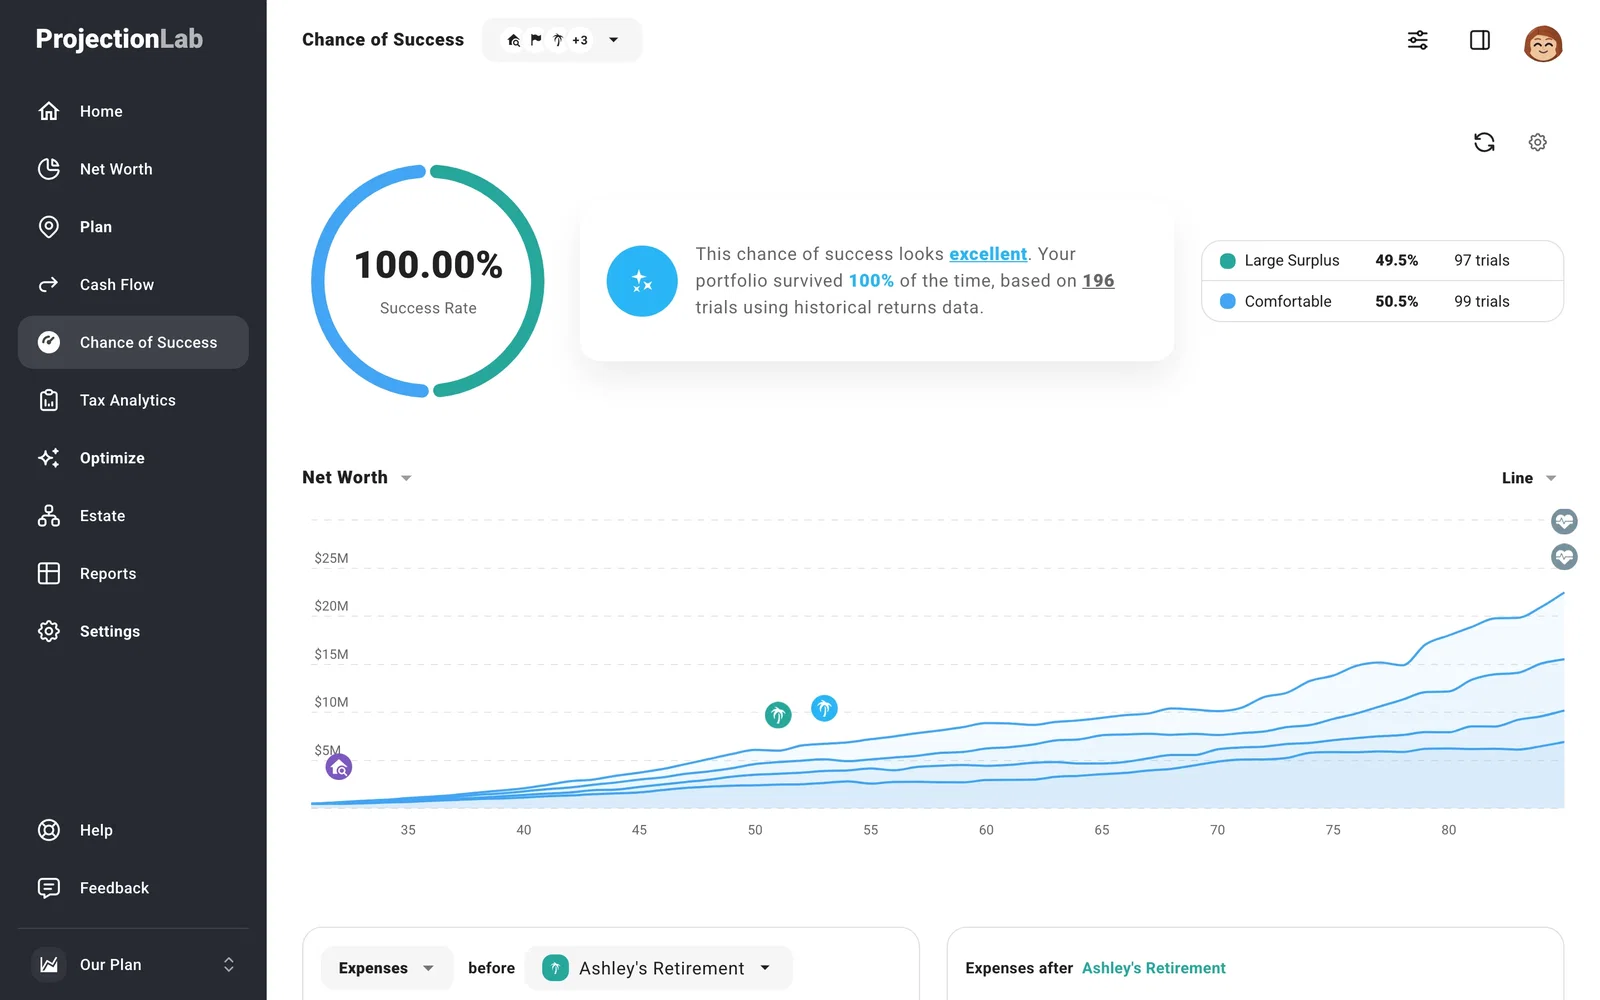
Chance of Success shows how your plan might hold up across many market conditions instead of relying on one forecast. Run it and explore the results when you’re ready.
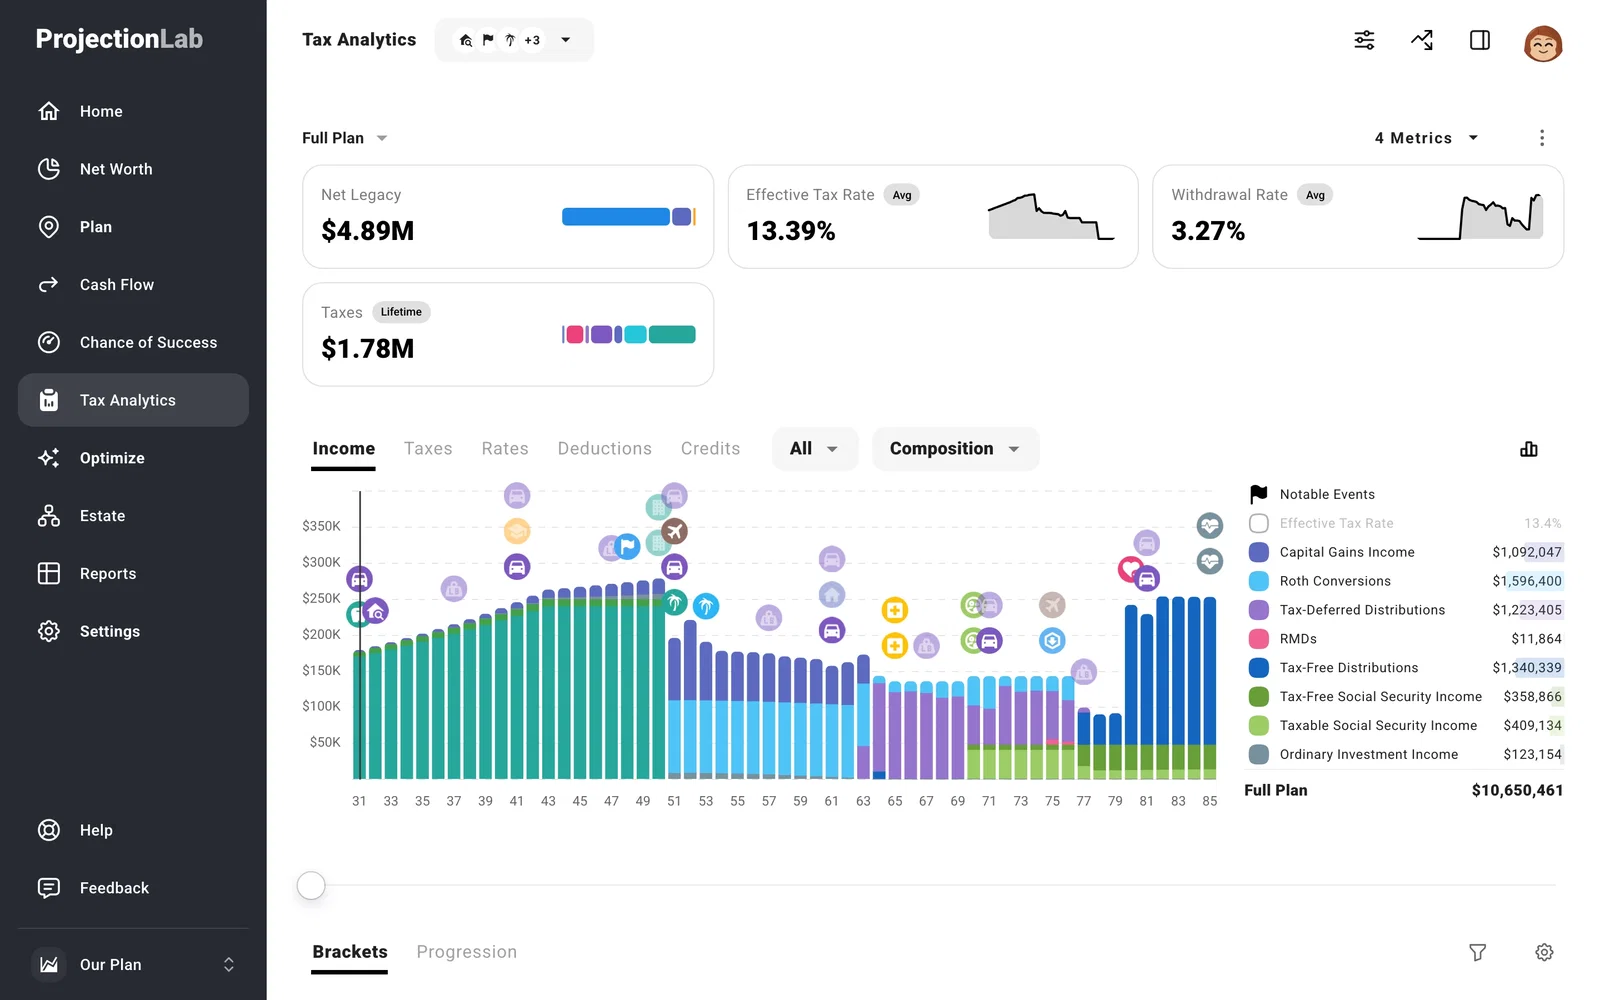
Tax Analytics helps explain the tax side of your plan. See how income, taxes, rates, deductions, and credits change over time. Explore the page when you want to look closer at a year.
Optimize your plan
The pages under Optimize help you explore how tax and spending strategies affect your plan.
Tax Strategy
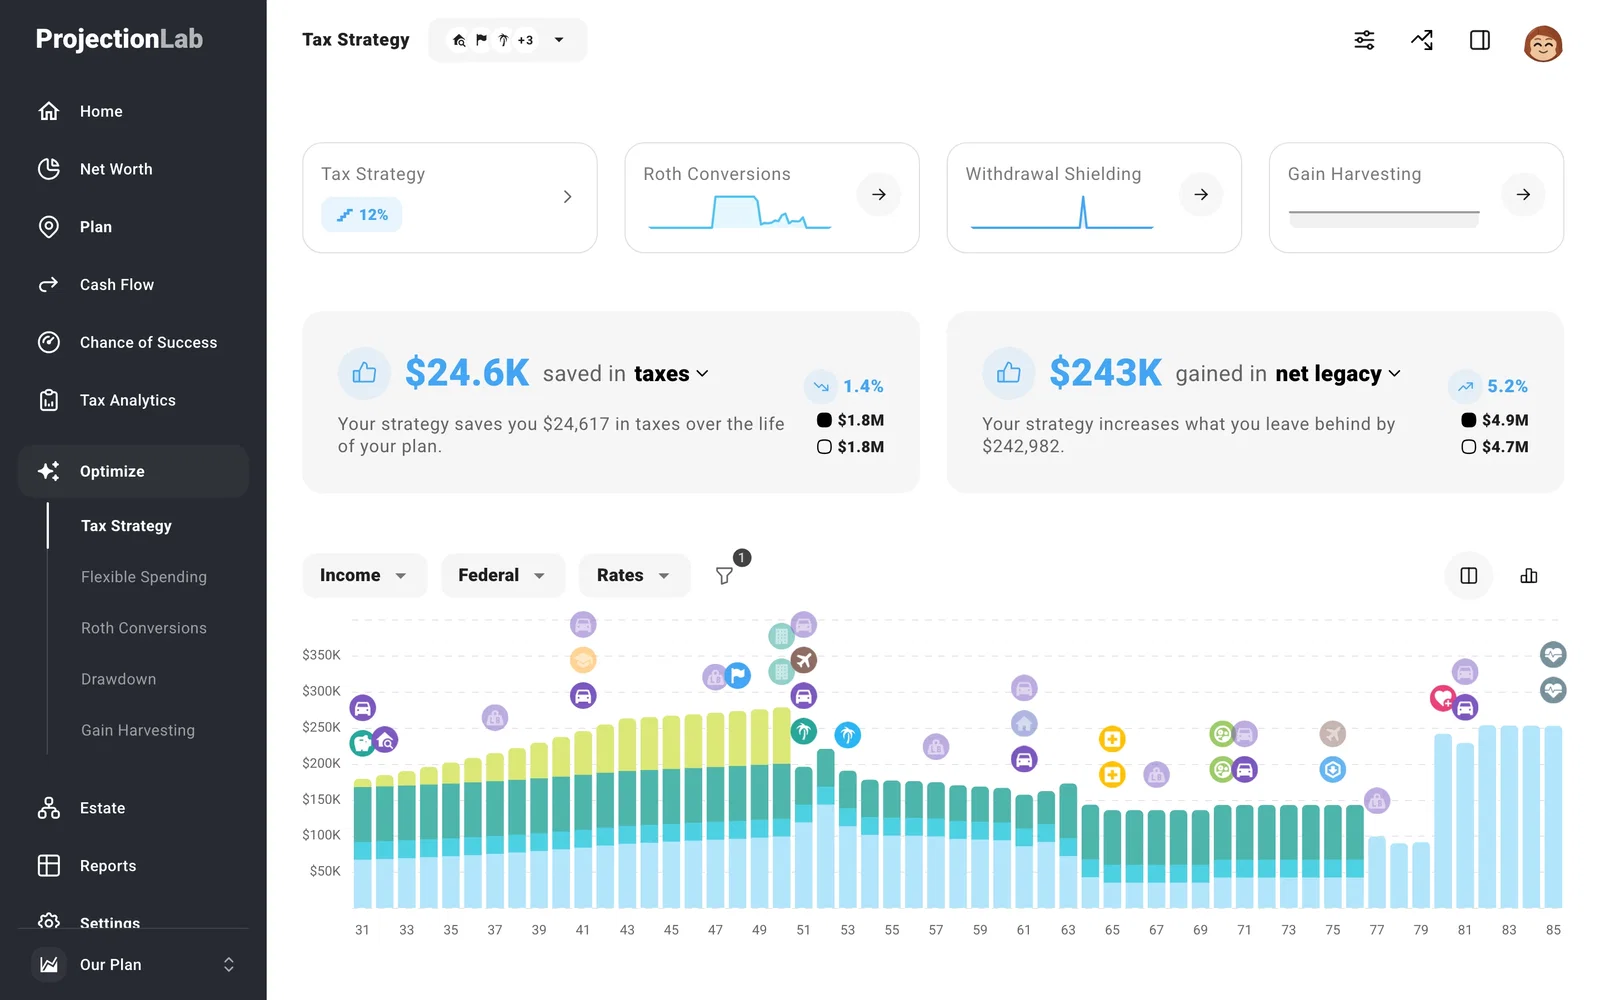
Tax Strategy shows the combined effect of Roth conversions, withdrawal shielding, and gain harvesting. Set a shared tax target, then compare alternatives or search for a strategy that fits your goal.
Flexible Spending
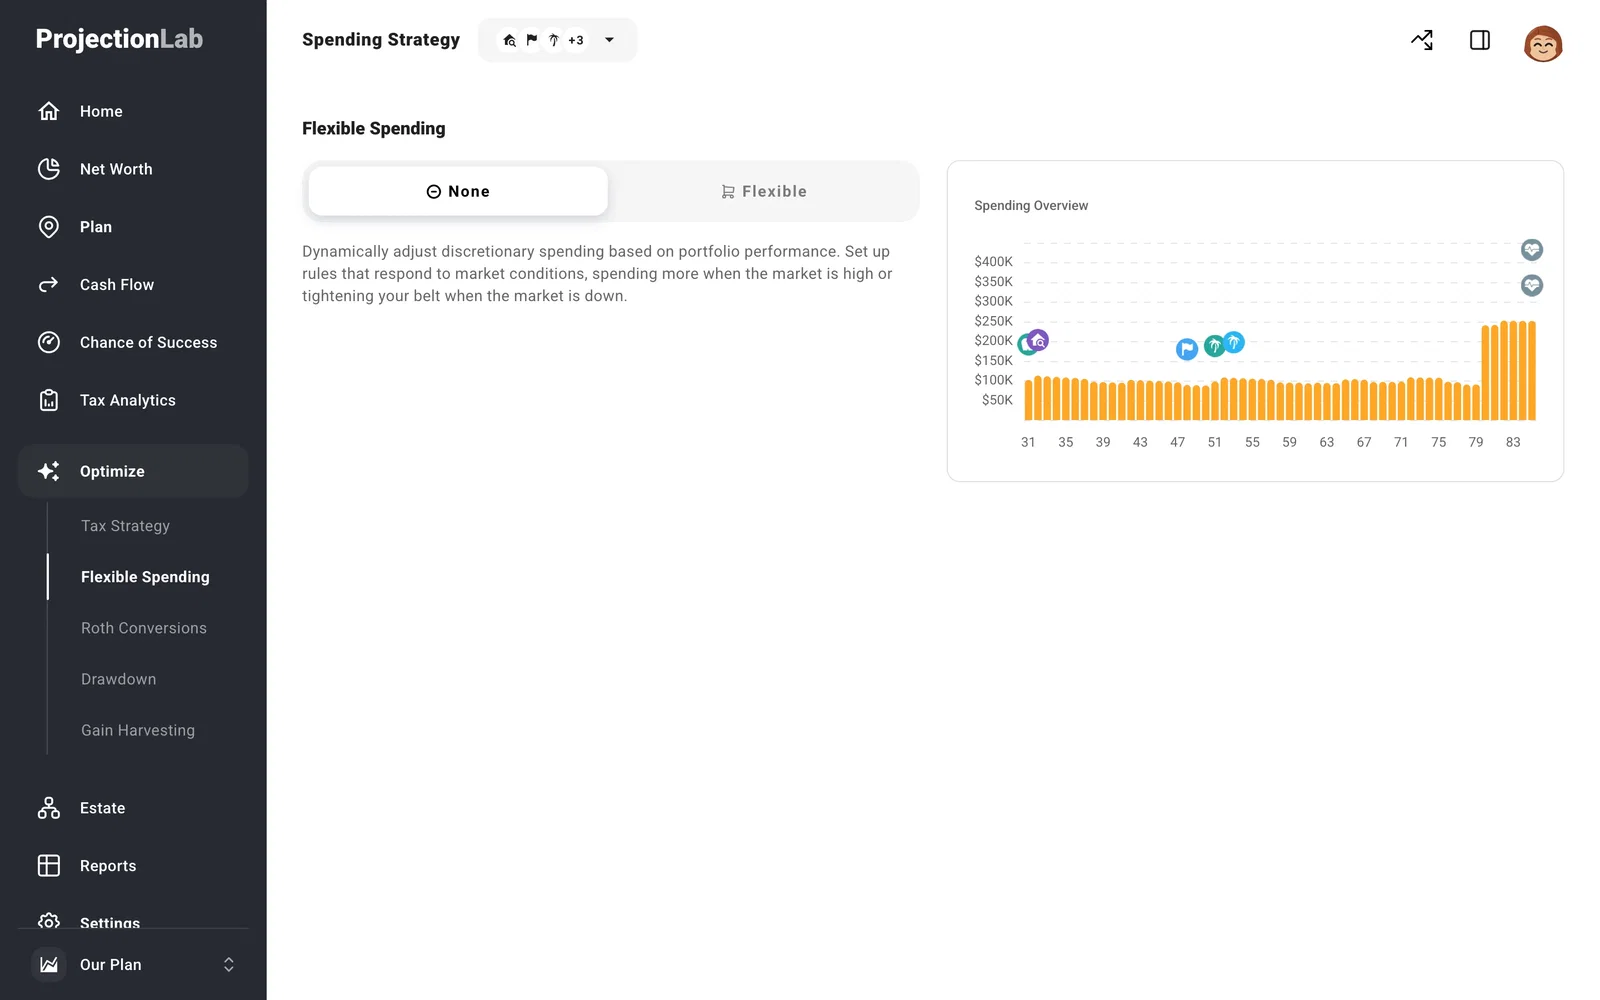
Flexible Spending lets you test how changing spending in response to market results could affect your plan. Choose a spending rule and compare it with your planned expenses.
Roth Conversions
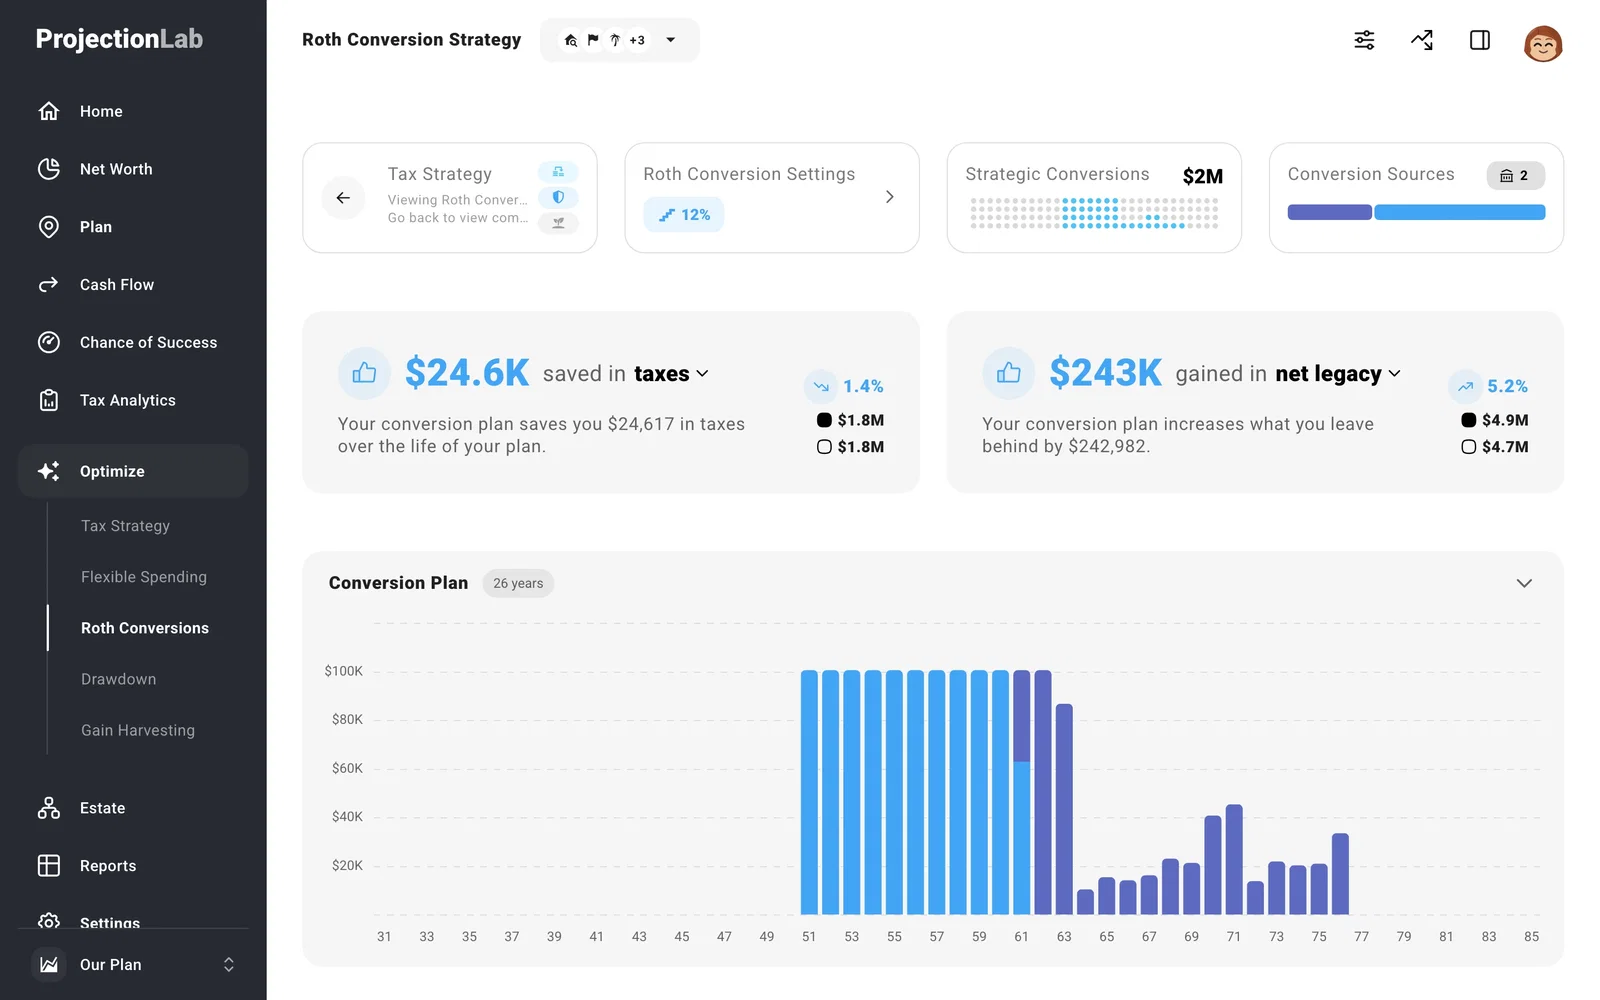
Roth Conversions shows the conversion amounts and years modeled by your strategy, along with the estimated effect on taxes and your estate.
Drawdown
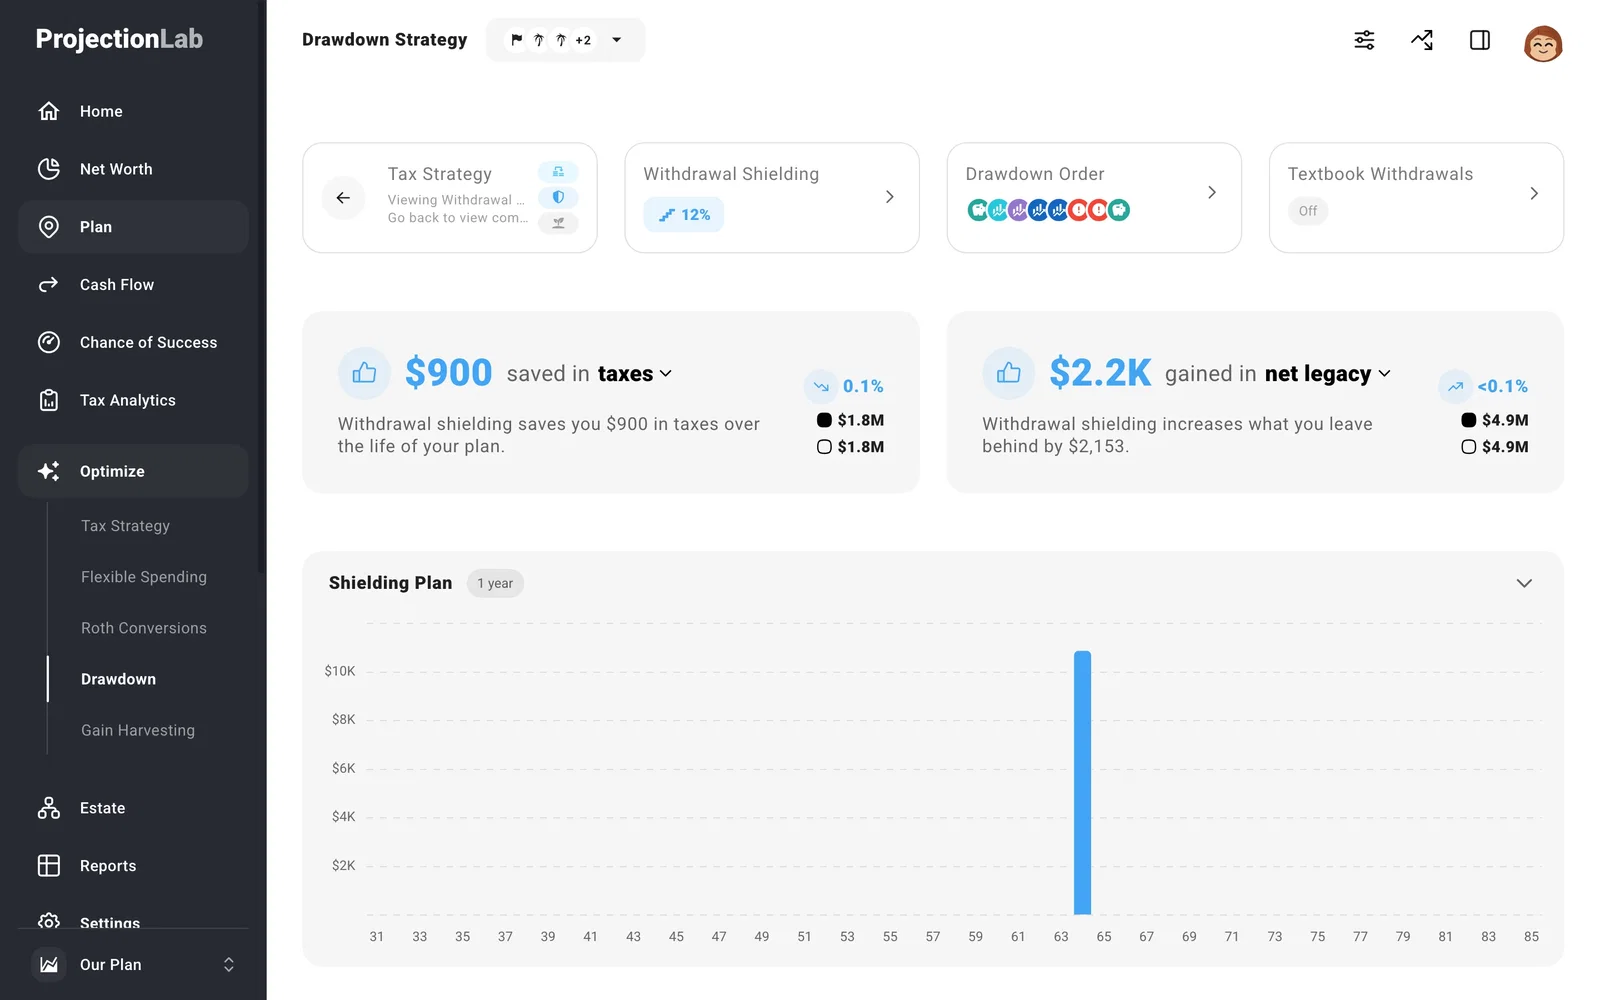
Use Drawdown to choose which accounts fund spending first, limit taxable withdrawals with shielding, or test a textbook withdrawal rule.
Gain Harvesting
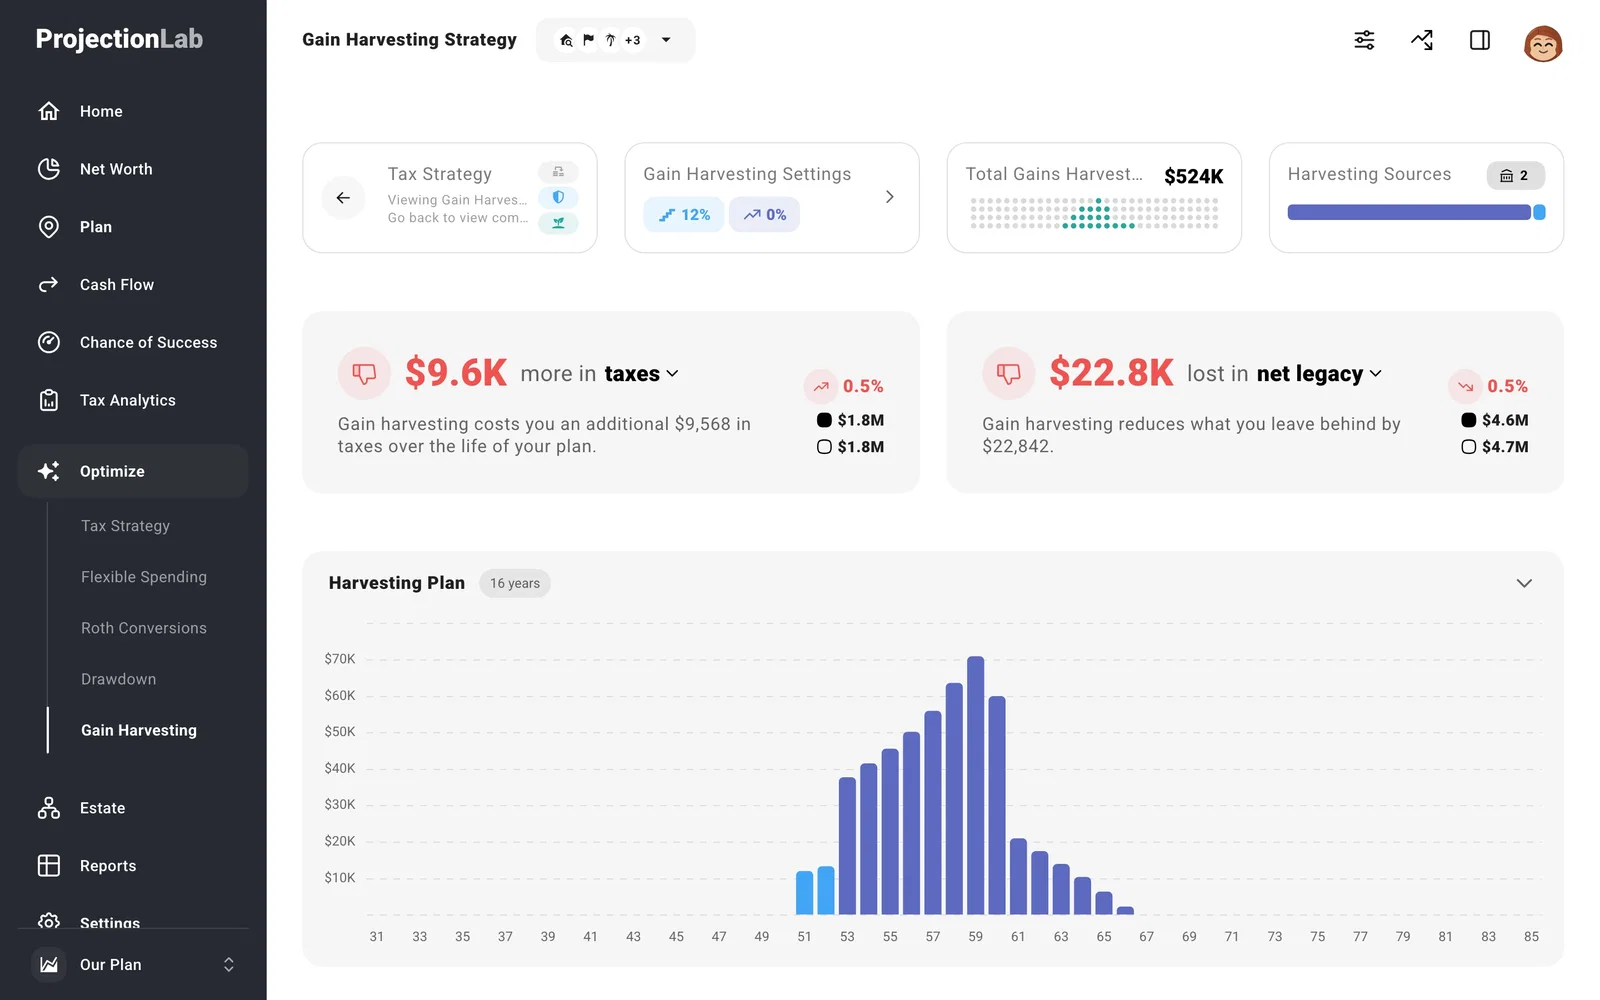
Gain Harvesting lets you plan when to realize investment gains. Compare the tax cost now with the estimated effect on future taxes and what remains at the end of the plan.
Estate and reports
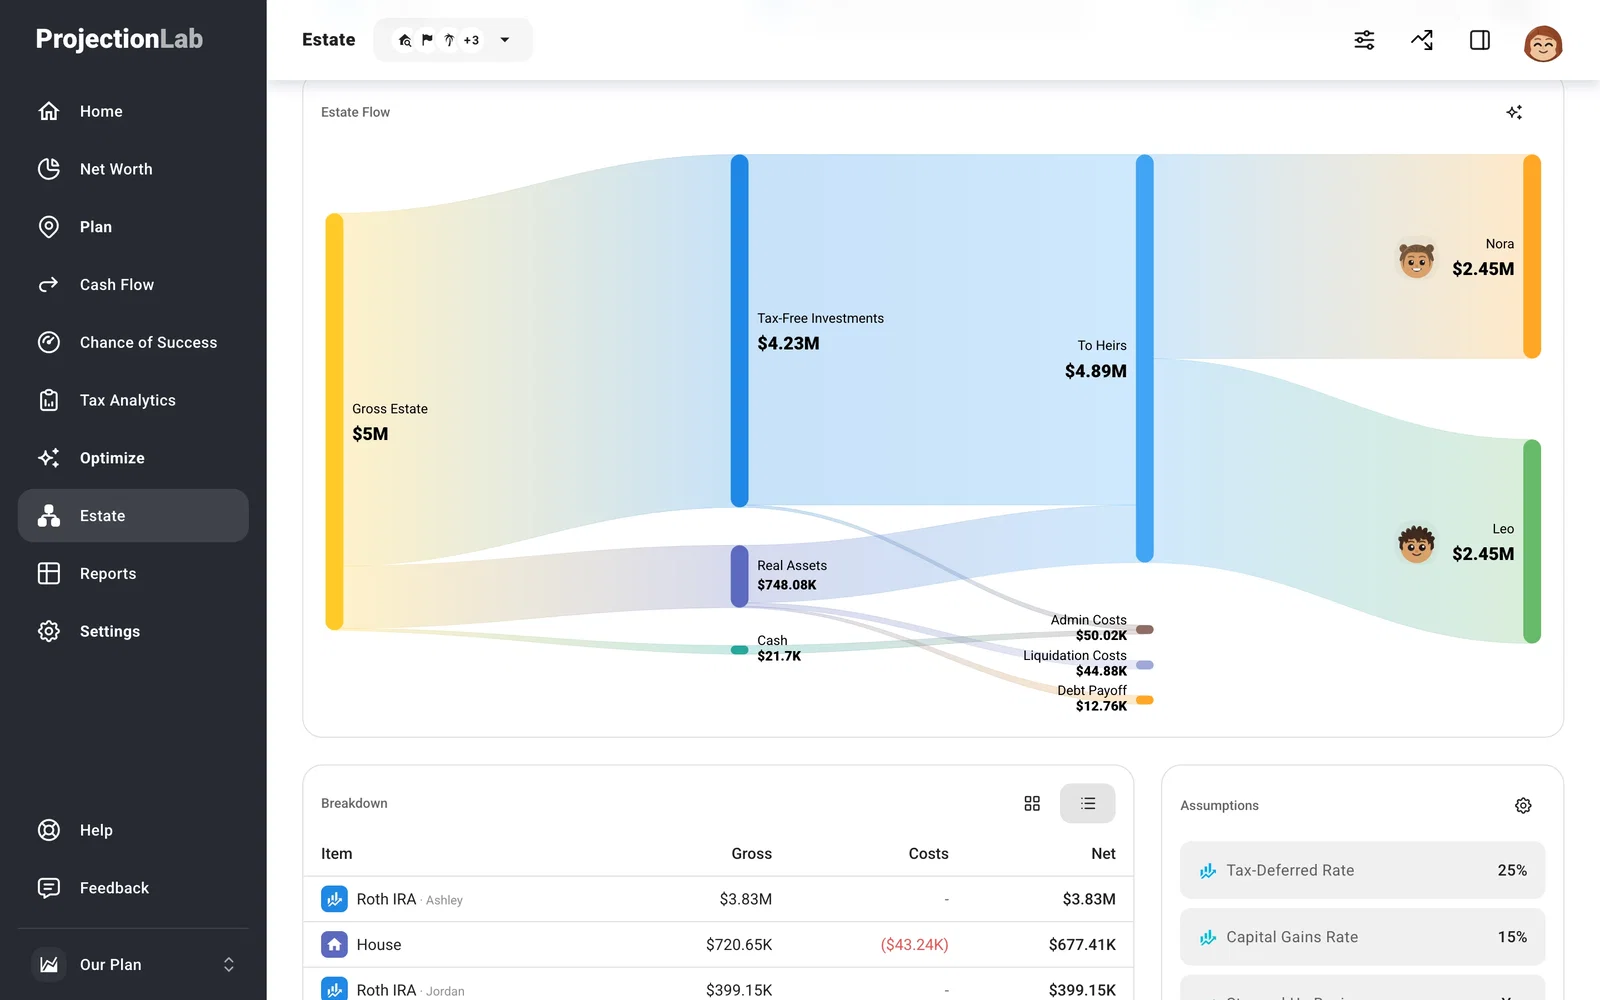
Estate shows what your plan could leave behind after estimated taxes and costs, and how that amount reaches your heirs. You can set your estate assumptions there too.
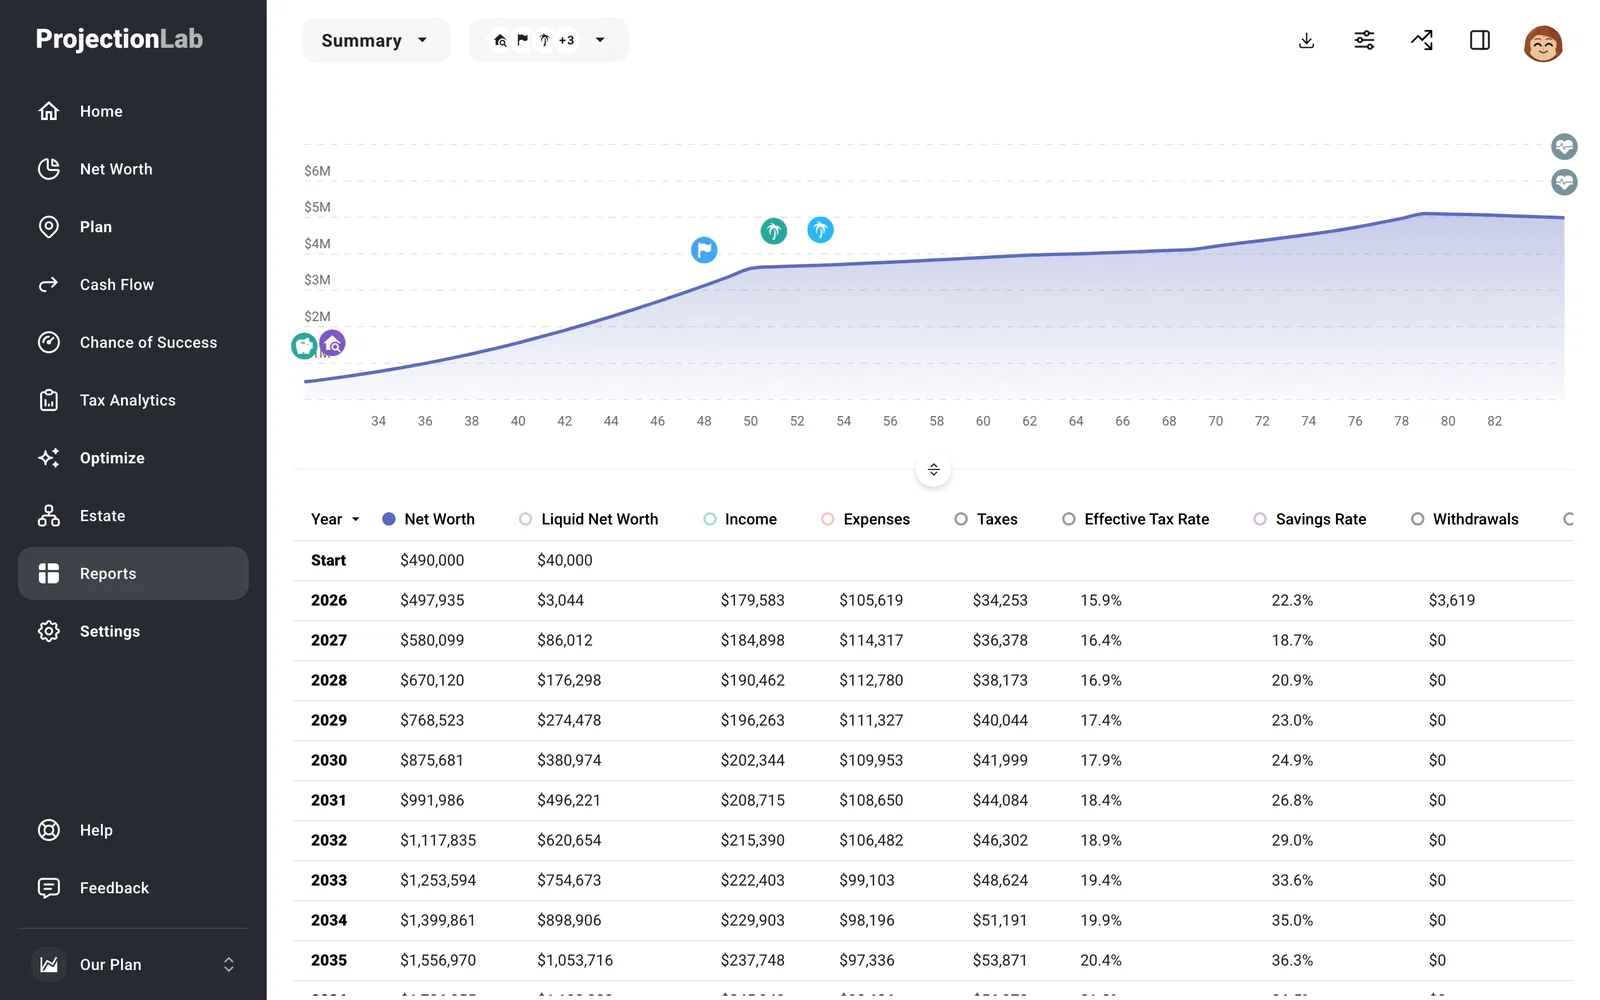
Reports has year-by-year figures and downloads for a closer look at your plan’s numbers. Explore and export a report when you need the detail behind a chart.
Settings
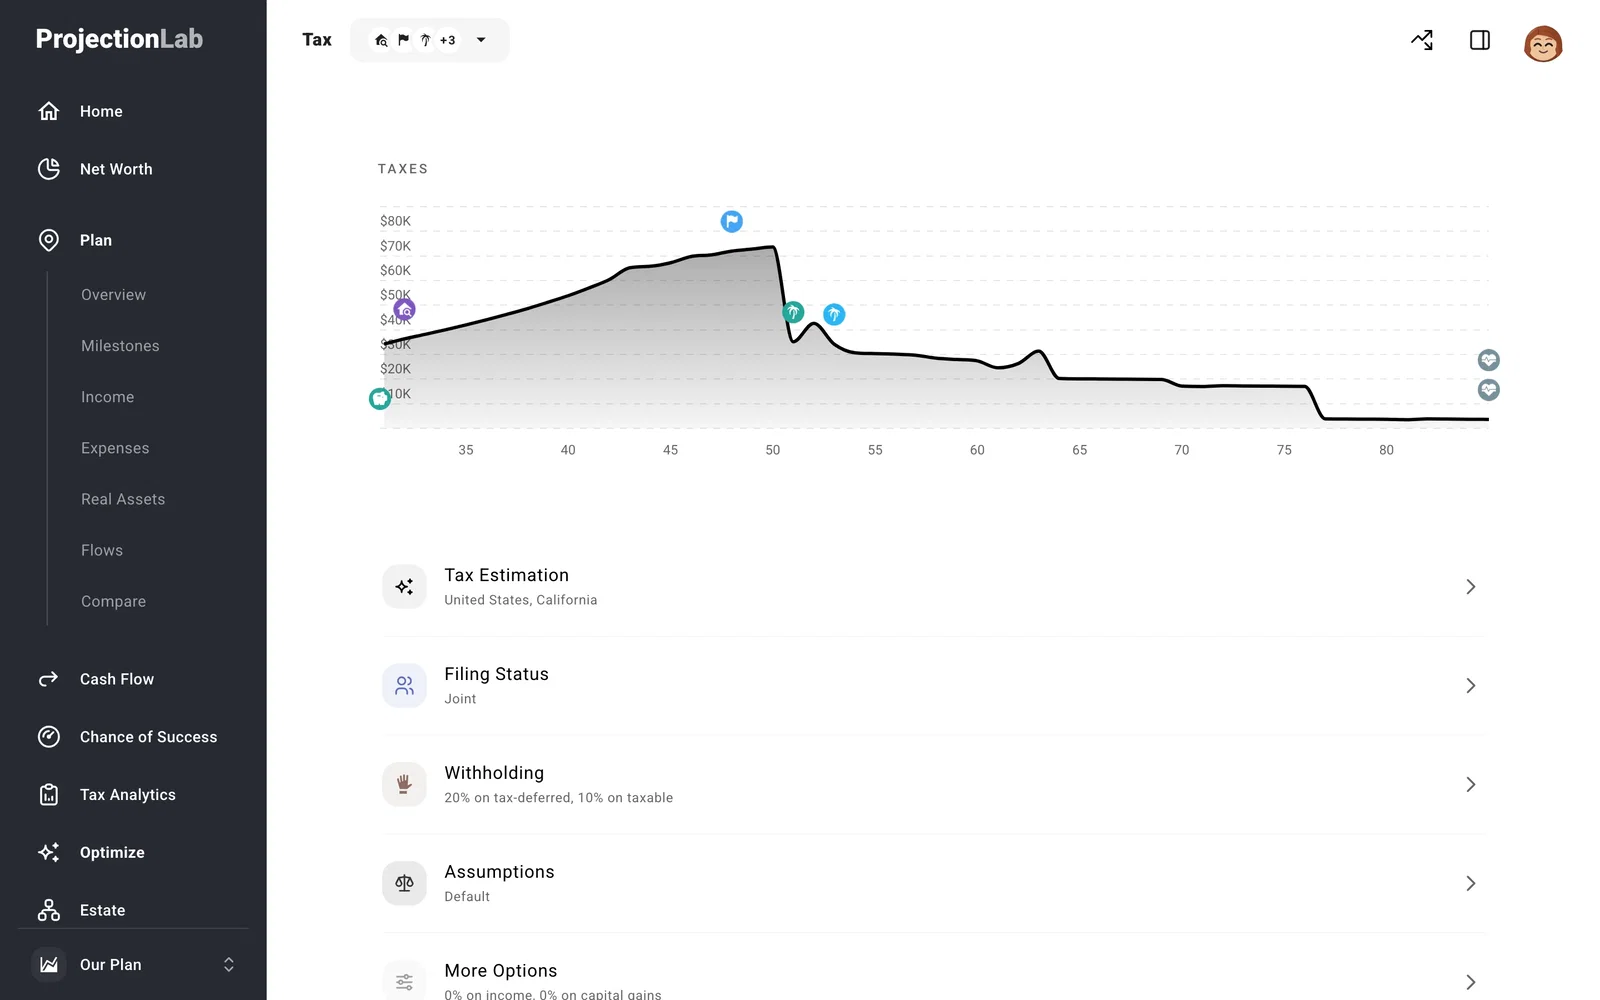
Use Settings for tax assumptions, growth and inflation rates, and what your plan metrics include. The plan selector at the bottom left lets you switch plans.
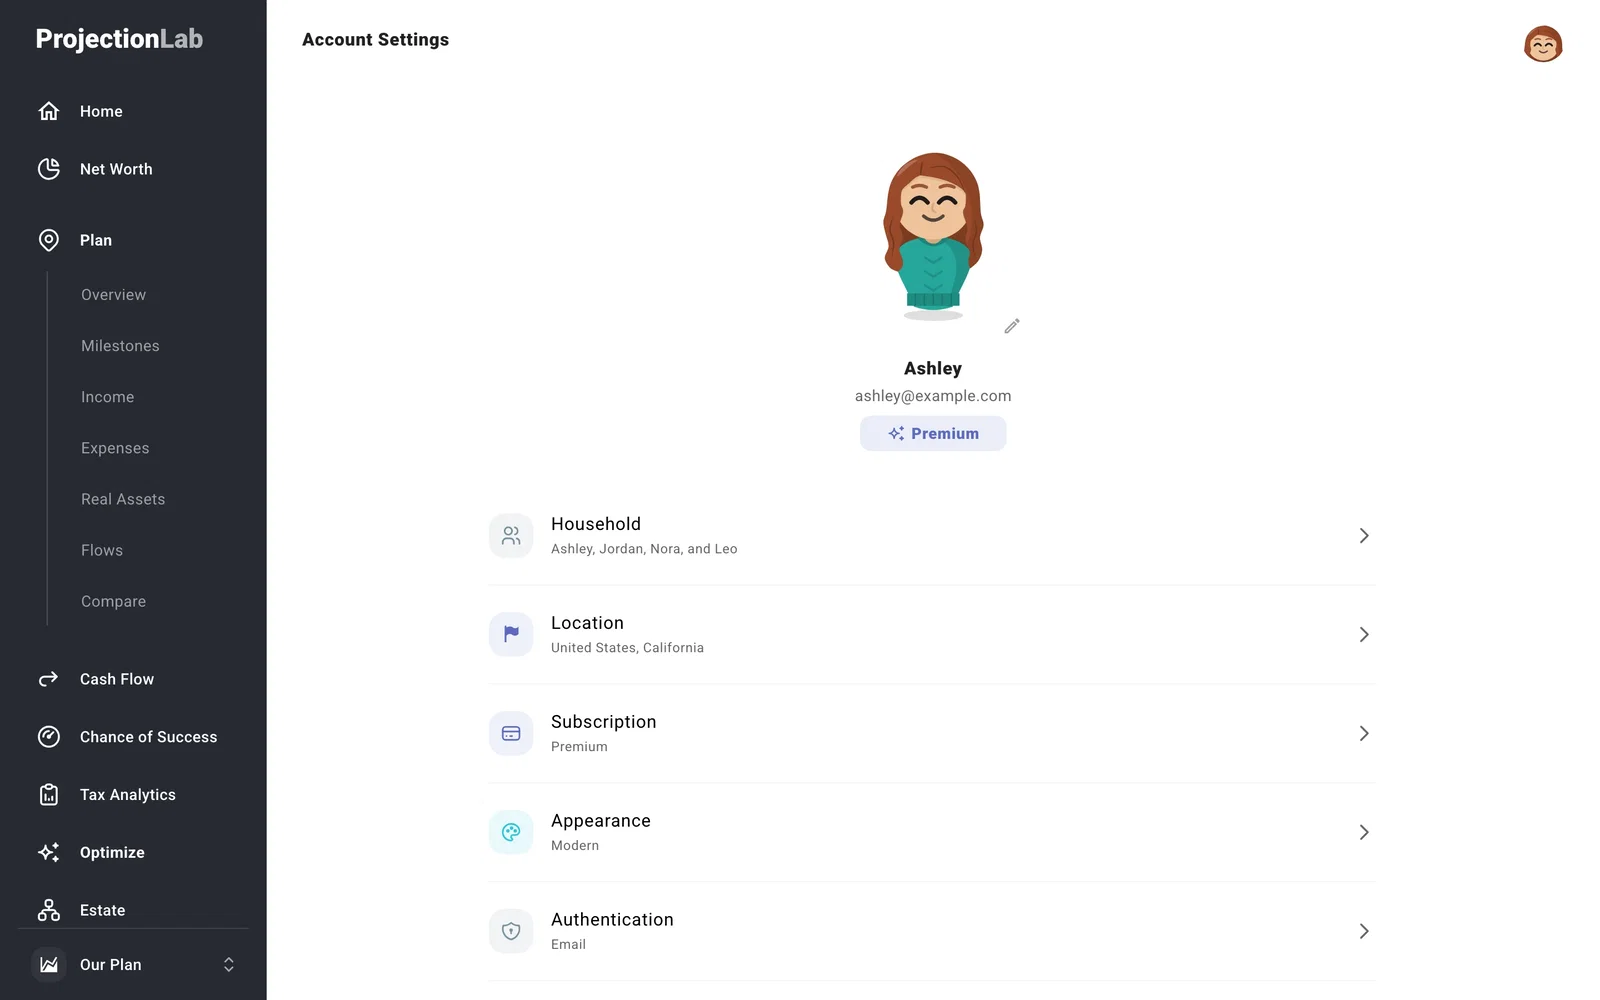
Your account menu has a separate Account Settings page for your subscription, sign-in method, appearance, and account data.
Next: Basic vs Premium
