Explore and export your results in Reports
Open Reports from the navigation for a year-by-year table of your plan, with a chart above it when you want one. Select the report name at the top left to choose a view.
Summary brings together the main plan figures. Income breaks down where income comes from, while Rates shows the growth, dividend, and inflation rates used in the plan. Choose a chart under Plots to turn it into a table, or Explore to pick your own mix of metrics.
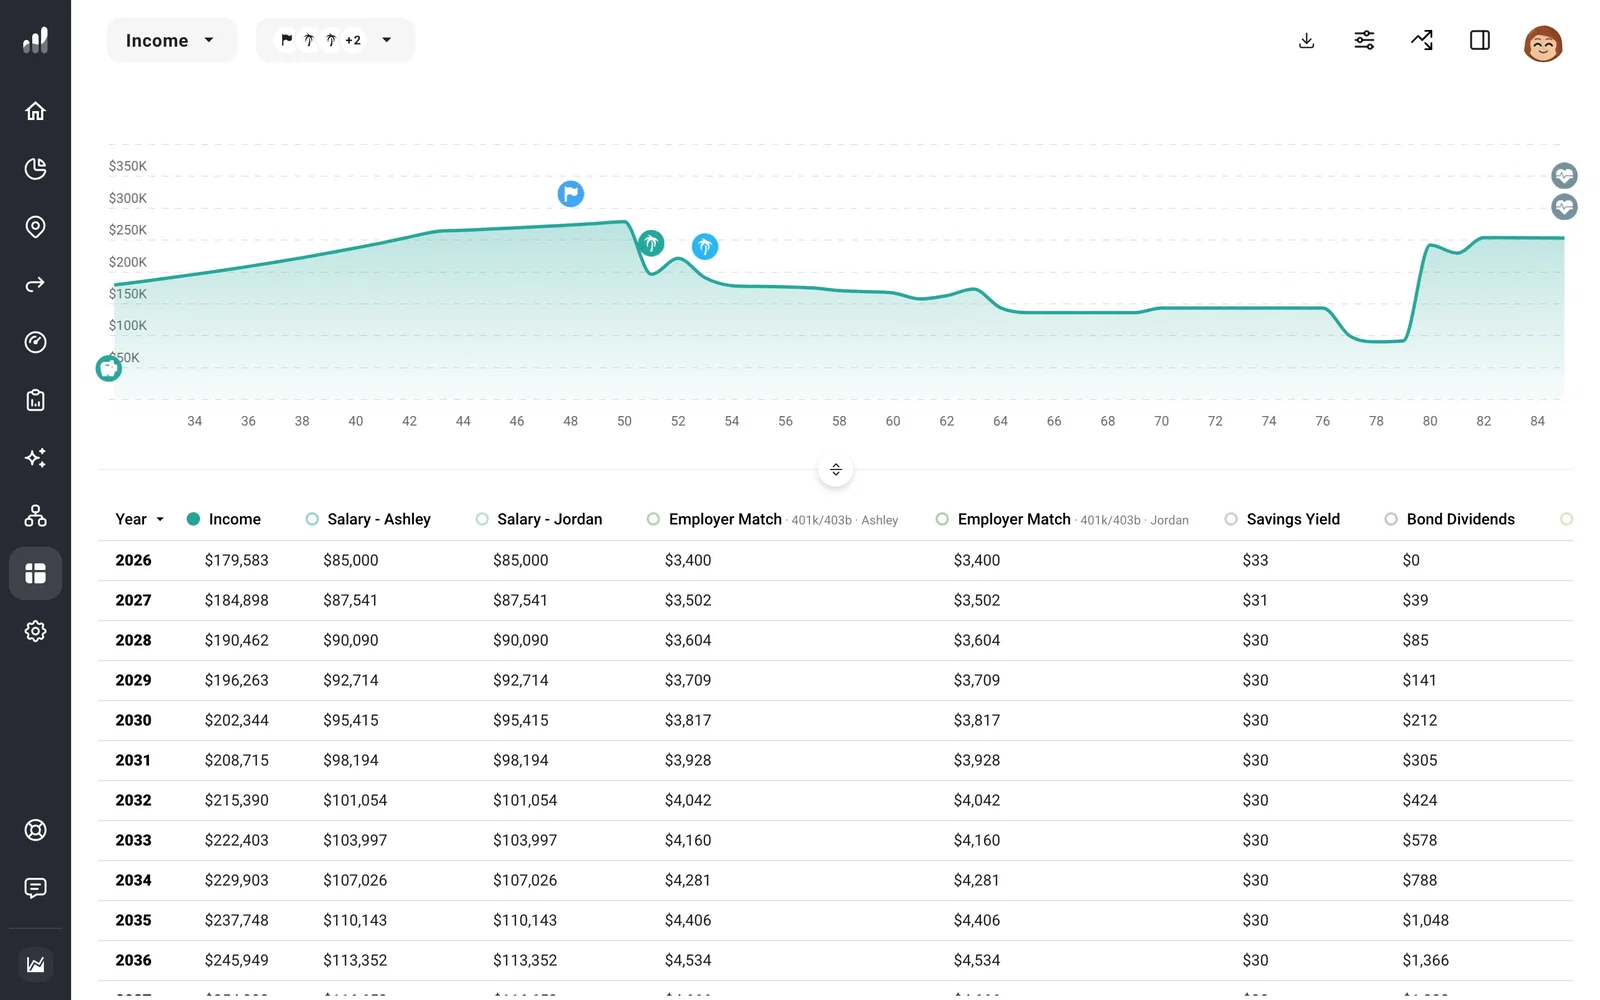
In Explore, open Metrics to add or remove columns. Hover a table row to find the same year in the chart. To give the table more room, turn off Show Chart in Display Options.
The first column can show calendar years or either partner’s age. Choosing a person’s age relabels the household timeline; it does not filter the results to that person.
Export a report
Select Export, the download icon at the top right, to export the year-by-year table as CSV or JSON, or a PDF that also includes the current chart when available.
Note
Time Range limits the chart, not the table or its export. Hiding a chart series also leaves that column in the table and download. Hide Amounts does not remove values from CSV or JSON exports.
If you want to build a new chart for both Plan > Overview and Reports, use Plot Builder.
